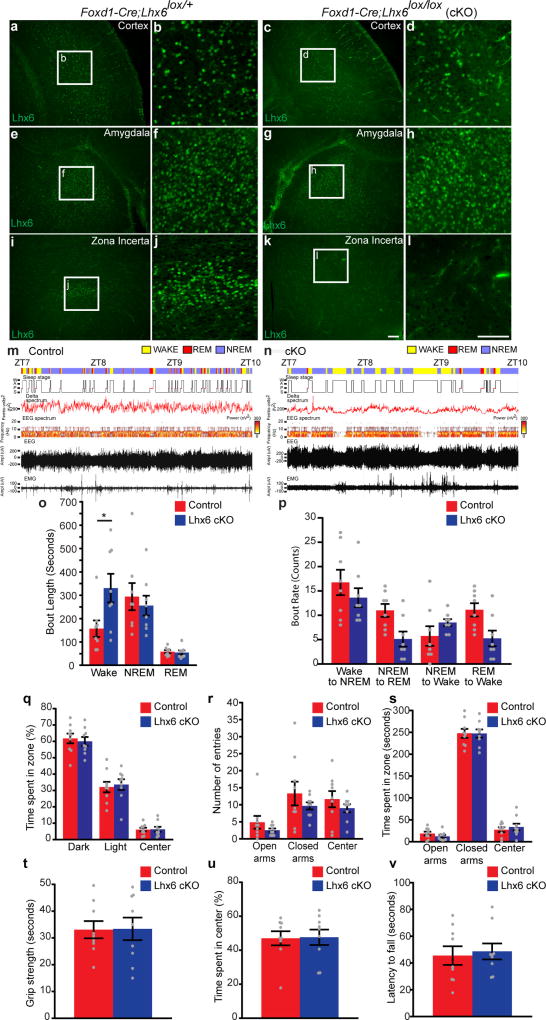
Extended Data Figure 6. Lhx6 expression is selectively deleted in the diencephalon, but preserved in the telencephalon of Lhx6-conditional knockout Foxd1-cre;Lhx6lox/lox (cKO) line, and Lhx6 cKO mice do not display obvious behavioural abnormalities other than changes in sleep patterns.
Continued from Fig. 3. a–l, Representative images of Lhx6 immunostaining (green) in the cortex (a–d), amygdala (e–h) and zona incerta (i–l) of control (a, b, e, f, i, j) and cKO (c, d, g, h, k, l) mice. Magnified images of a, c, e, g, i, k are shown in b, d, f, h, j, l, respectively. Note an absence of Lhx6 expression in the zona incerta of the cKO group. Scale bars, 100 µm. m, n, Sample EEG recordings for control (m) and cKO (n) mice with wake (yellow), REM sleep (red) and NREM sleep (purple) indicated, along with hypnogram (sleep stage), FFT-derived delta power (femtovolts2), EEG spectrum (frequency), EEG raw activity (amplitude) and EMG raw activity (amplitude) between ZT7 and ZT10. o, p, Bout length quantification (o) showing the duration of wake, NREM and REM episodes and bout count quantification (p) showing sleep–wake transitions in control (Foxd1-cre;Lhx6lox/+) and cKO (Foxd1-cre;Lhx6lox/lox) groups. Two-way ANOVA followed by Sidak’s post hoc test. n = 8 control and 8 cKO mice. q–v, Light–dark preference test (q), EPM (r, s), grip strength (t), open field test (u) and rotarod (v) were conducted in control (red) and Lhx6 cKO (blue) groups. *P < 0.05 for changes in sleep patterns (m–p); no significant difference (P > 0.1) was detected for all other behaviours (q–v) analysed; two-way ANOVA followed by Sidak’s post hoc test. Data are mean ± s.e.m. n = 8 control and 8 cKO mice.

