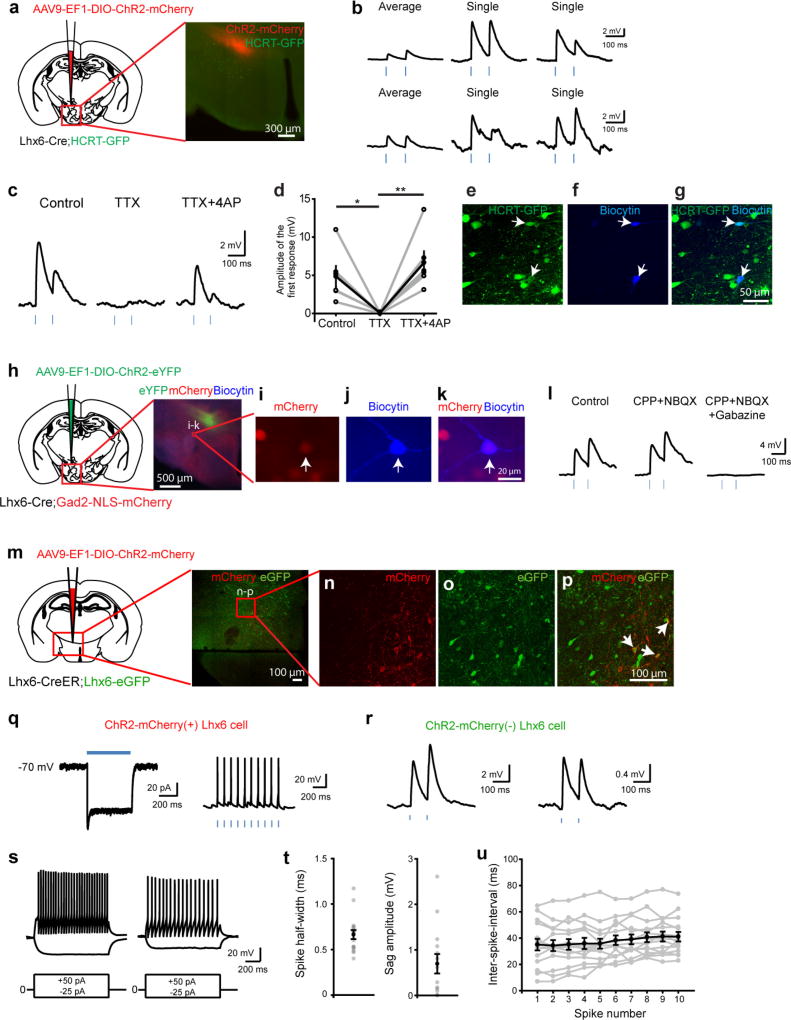
Extended Data Figure 5. Synaptic outputs of Lhx6 neurons in the zona incerta.
Continued from Fig. 2. a, Schematic showing injection of AAV9-DIO-ChR2–mCherry into the zona incerta of Lhx6-cre;Hcrt–eGFP mice. The red box shows the location of Hcrt-expressing neurons (green) in the lateral hypothalamus and the ventromedial portion of the zona incerta with ChR2-expressing Lhx6+ neurons (red) shown in the image on the right. Scale bar, 300 µm. b, Responses of two Hcrt neurons to brief (3 ms) photostimulation of ChR2-expressing Lhx6 axons. The average responses (left) and two representative responses (right) are shown for each neuron. The responses are depolarizing owing to the high chloride internal solution used. The amplitude of the average responses was smaller than for individual responses because of the failure rate to any individual photostimulation (24.0 ± 5.9%, range 65.8–0%; n = 15 cells). c, Average responses recorded from a Hcrt neuron to photostimulation of ChR2-expressing Lhx6 axons under control conditions (left), following bath application of the sodium channel blocker tetrodotoxin (TTX, middle) and following the addition of the potassium channel blocker 4-AP (right). Note that the cell shows a depolarizing response owing to the high chloride internal recording solution. d, Summary data showing the amplitude of the average response to the first photostimulation under control conditions, following bath application of TTX and TTX together with 4-AP. The responses recorded using a high chloride internal solution in TTX and 4-AP treatment indicate that ChR2-expressing Lhx6+ VZI neurons form monosynaptic connections onto the recorded Hcrt+ neurons (control, 4.85 ± 1.37 mV; TTX, 0.07 ± 0.04 mV; TTX + 4-AP, 6.65 ± 1.50 mV; two-way ANOVA with Bonferroni correction, control versus TTX, *P = 0.01498; TTX versus TTX + 4-AP, **P = 0.00178, control versus TTX + 4-AP, P = 0.61814; n = 6 cells from four mice). e–g, Expression of eGFP (e, green) in recorded Hcrt–eGFP neurons was confirmed by filling the recorded cells in the lateral hypothalamus with biocytin (f, blue). Arrows indicate colocalization of the two markers in the recorded neurons as seen in the merged image (g). Scale bar, 50 µm. h, Schematic showing injection of AAV9-DIO-ChR2–eYFP into the zona incerta of Lhx6-Cre;Gad2-NLS–mCherry mice (left). The red box shows the location of the image (right) showing Gad2-expressing neurons (red) in the lateral hypothalamus and Lhx6+ neurons (green) in the ventromedial portion of the zona incerta. Scale bar, 500 µm. i–k, Colocalization of mCherry (i, red) in Gad2-NLS–mCherry mice with biocytin (j, blue) in Gad2+ neurons recorded in the lateral hypothalamus. The arrow indicates colocalization of the two markers as seen in the merged image (k). Scale bar, 20 µm. l, Average responses recorded from a Gad2-expressing neuron to brief (3 ms) photostimulation of ChR2-expressing Lhx6 axons under control conditions (left), following bath application of the ionotropic glutamate receptor antagonists, CPP and NBQX (middle) and following the addition of the GABAA receptor antagonist, gabazine (right). Note that the response is depolarizing owing to the high concentration of chloride in the internal recording solution. Responses were eliminated in the presence of gabazine (control, 3.96 ± 1.55 mV; CPP + NBQX, 3.48 ± 2.16 mV; CPP + NBQX + gabazine: 0.01 ± 0.01 mV; n = 3 cells from two mice). m, Schematic showing injection of AAV9-DIO-ChR2–mCherry virus into the zona incerta of Lhx6-creERT2;Lhx6–eGFP mice (left). The red box indicates the location of a representative image from one mouse (right) showing mCherry-expressing (red) and eGFP-expressing (green) Lhx6+ neurons in the zona incerta. The red box indicates the location of higher magnification images in n–p. Scale bar, 100 µm. n–p, Expression of mCherry (n, red) and eGFP (o, green) in Lhx6-creERT2;Lhx6–eGFP mice injected with AAV9-DIO-ChR2–mCherry in the zona incerta. The merged image is shown in p. Arrows in p indicate a subset of Lhx6+ neurons that express both ChR2–mCherry and eGFP. Scale bar, 100 µm. q, Average response elicited by 500 ms photostimulation in a ChR2-expressing Lhx6+ VZI neuron recorded in whole-cell voltage-clamp mode (left) and a representative trace of action potentials elicited by brief 3-ms flashes of blue light (10 Hz) recorded in current-clamp in the same neuron (right). Note that the train of light pulses reliably elicits action potentials. Responses to 500-ms long light pulses recorded in voltage-clamp were used to distinguish ChR2-expressing from non-ChR2-expressing Lhx6+ VZI neurons. r, Representative average responses of two non-ChR2-expressing Lhx6+ neurons to photostimulation of axons of ChR2-expressing Lhx6+ neurons. The responses are depolarizing because of the high concentration of chloride in the internal recording solution. s, Representative responses from two Lhx6+ neurons in response to steps of depolarizing (+50 pA) current. Average responses to hyperpolarizing current steps (−25 pA) are also shown. t, The spike half-width (left; n = 17 cells) and sag amplitude (right; n = 14 cells) of recorded Lhx6+ neurons. The mean ± s.e.m. of the responses are shown in black. u, Plot of the inter-spike intervals for trains of action potentials elicited in Lhx6+ neurons by 1-s steps of depolarizing current. The mean ± s.e.m. of the responses are shown in black (n = 15 cells).

