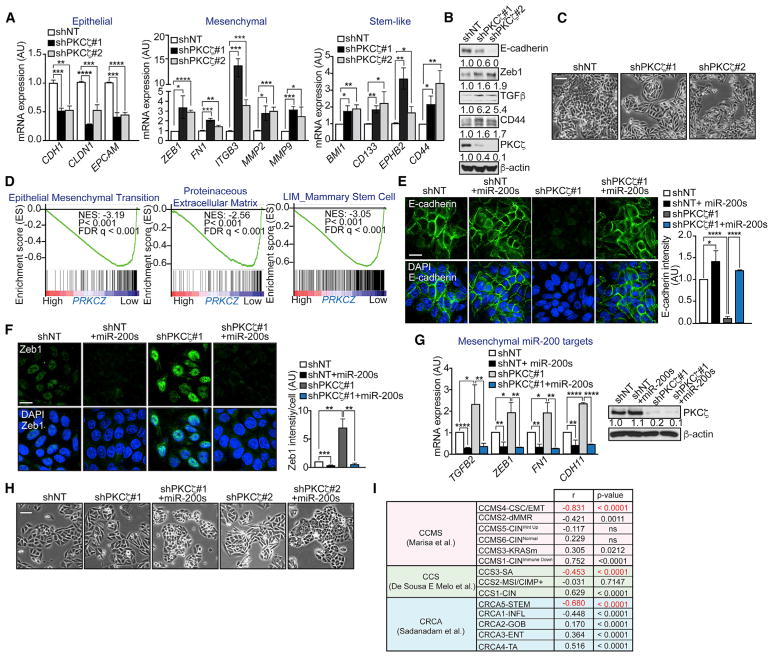
Figure 2. Loss of PKCζ Promotes EMT through miR-200s.
(A) qPCR of epithelial, mesenchymal, and stem-like genes in SW480 shNT and shPKCζ cells; n = 3 biological replicates.
(B) Immunoblot of EMT markers in SW480 shNT and shPKCζ cells; n = 3 biological replicates.
(C) Representative pictures of cell morphology of SW480 shNT and shPKCζ cells. Scale bar, 50 μm.
(D) GSEA plot of EMT, extracellular matrix remodeling, and stem-like signatures in low-versus high-PRKCZ-expressing tumors from TCGA-COAD. FDR, false discovery rate; NES, normalized enrichment score.
(E) Immunofluorescence for E-cadherin (left) and quantification of E-cadherin intensity (right) in SW480 shNT, shPKCζ, and shPKCζ cells rescued with miR-200a/b. Scale bar, 20 μm; n = 3 biological replicates.
(F) Immunofluorescence for Zeb1 (left) and quantification of Zeb1 intensity (right) in SW480 shNT, shPKCζ, and shPKCζ cells rescued with miR-200a/b. Scale bar, 20 μm; n = 3 biological replicates.
(G) qPCR of mesenchymal genes (left) and immunoblot of PKCζ (right) in SW480 shNT, shPKCζ, and shPKCζ cells rescued with miR-200a/b; n = 3 biological replicates.
(H) Representative pictures of cell morphology of SW480 shPKCζ cells rescued with miR-200a/b. Scale bar, 50 μm.
(I) Summary of the correlation between PRKCZ gene neighbors and CRC gene set signatures.
Results are presented as mean ± SD. *p < 0.05, **p < 0.01, ***p < 0.001, ****p < 0.0001.

