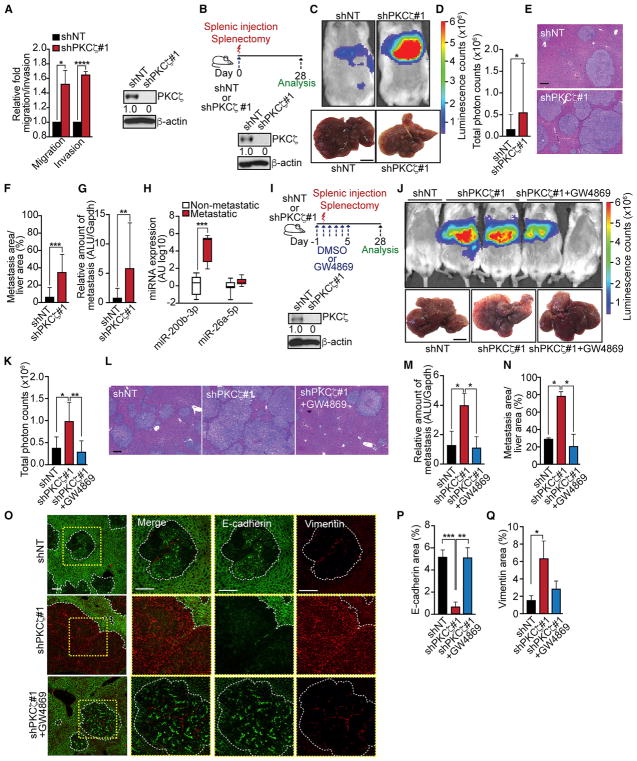
Figure 5. Loss of PKCζ Promotes Liver Metastasis.
(A) Cell migration and invasion assay (left) and immunoblot of PKCζ (right) in SW480 shNT and shPKCζ cells; n = 3 biological replicates.
(B–G) Experimental design for liver metastases and immunoblot of PKCζ (B) in SW480 shNT and shPKCζ cells used for splenic injection (n = 8 mice per group); bioluminescence imaging and liver photographs; scale bar, 1 cm (C); quantification of total photon counts (shNT, n = 7; shPKCζ, n = 8) (D); H&E staining of liver sections; scale bar, 200 μm (E); quantification of metastatic area relative to total liver area (F); and quantification of human metastases in mouse liver by qPCR (G).
(H) qPCR of miRNAs in exosomes from plasma of non-metastatic (n = 8) and metastatic (n = 6) patients.
(I–N) Experimental design for inhibiting CRC liver metastases with GW4869 and immunoblot of PKCζ (I) in SW480 shNT and shPKCζ cells used for splenic injection; bioluminescence imaging and liver photographs of mice injected with SW480 shNT (n = 4), shPKCζ (n = 4), or shPKCζ cells + GW4869 (n = 5); scale bar, 1 cm (J); quantification of total photon counts (K); H&E staining of liver sections; scale bar, 200 μm (L); quantification of human metastases in mouse liver by qPCR (M); and quantification of metastatic area relative to total liver area (N).
(O–Q) Immunofluorescence for E-cadherin and vimentin of liver metastases of the experiment described in (I) (n = 3); scale bars, 50 μm (O). Quantification of E-cadherin (P) and vimentin (Q) areas.
Results are presented as mean ± SD. *p < 0.05, **p < 0.01, ***p < 0.001, ****p < 0.0001.

