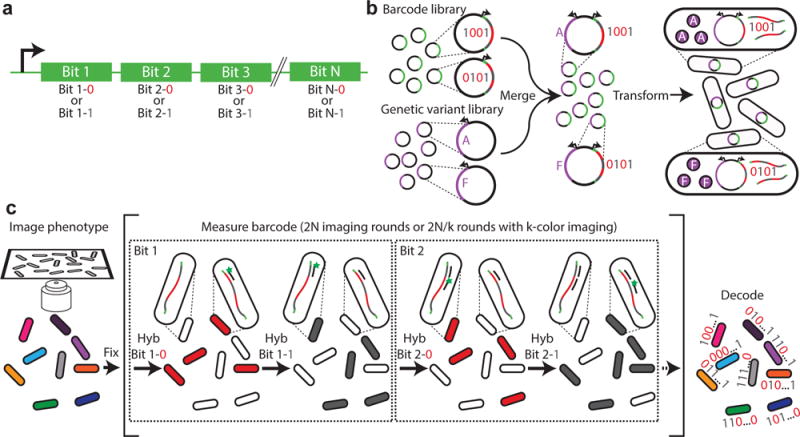
Fig. 1. A high-throughput, image-based screening method using massively multiplexed fluorescence in situ hybridization.

(a) Schematic depiction of a nucleic acid barcode. Each barcode consists of the concatenation of hybridization sites, each of which is associated with a different bit in a N-bit binary barcode. Each hybridization site can utilize one of two readout sequences unique to that site, with one readout sequence representing the value of “1” and another representing “0”. (b) Schematic depiction of barcoded genetic variant library construction. The library of barcodes is merged with a library of genetic variants and transformed into cells. (c) Schematic diagram of the image-based phenotype-genotype characterization. The phenotype is first imaged. Then, the cells are fixed, and multiple rounds of hybridization are used to measure the RNA barcodes expressed in the cells. During the first round, readout probe 1-0 is added and cells with barcodes that read “0” in bit 1, i.e. which contain the readout sequence 1-0, should bind to the probe and become fluorescent, whereas cells with barcodes that read “1” in bit 1 should remain dark. Once readout probe 1-0 is extinguished, readout probe 1-1 is added and the cells with barcodes that read “1” in bit 1 should become fluorescent. This process is repeated for the remaining bits, allowing the barcode of each cell, and hence the identity of the genetic variant contained in the cell, to be determined and linked to the measured phenotype of the cell.
