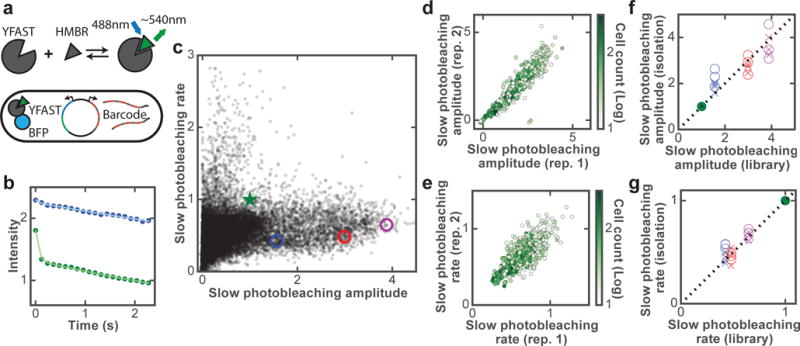
Fig. 3. Screening YFAST mutants for improved brightness and photostability.

(a) Schematic of YFAST library design. (b) Photobleaching curves of the original YFAST (green circles) and a mutant (blue circles) measured from single cells in the library measurement with fits to a double exponential decay (solid lines). (c) Amplitudes and rate constants of the slow bleaching component for YFAST variants in all screened libraries. Results of the original YFAST and three selected mutants are indicated by the green star and colored circles, respectively. In the event that YFAST displays more complicated photobleaching kinetics beyond our measurement duration, the rate constants reported here should be considered the initial decay rates of the slow component. (d-e) Amplitude (d) and rate constant (e) of the slow bleaching component for two replicate library measurements containing a subset of mutants. Each point in (c-e) represents the median values of all cells corresponding to each mutant and only mutants containing at least 10 imaged cells are depicted. Furthermore, (e) only contains mutants with a slow amplitude that is at least half of that of the original YFAST. (f-g) Amplitudes (f) and rate constants (g) of the slow bleaching component for the three selected mutants (blue, red, purple) measured in isolation versus the library measurement results. Data from multiple technical replicates of isolation measurements conducted at the library-screen time resolution (120 ms; crosses) or at 4-ms time resolution (circles) are shown. In all panels, amplitudes and rate constants are normalized to those of the original YFAST (green).
