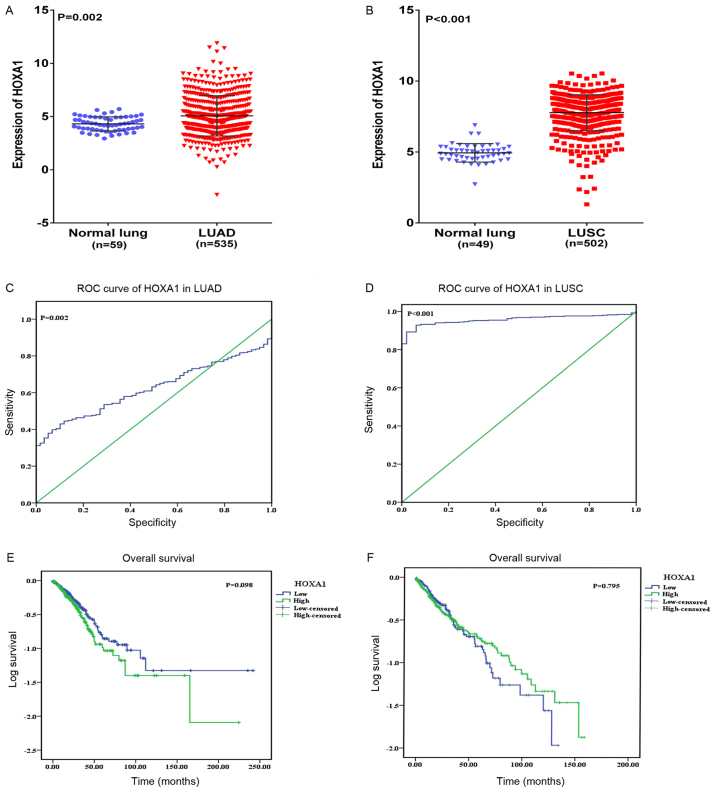
Figure 3.
Clinical significance of HOXA1 in LUAD and LUSC based on The Cancer Genome Atlas database. Differential expression of HOXA1 in (A) LUAD and non-cancerous lung tissue; and (B) in LUSC and non-cancerous lung tissue. (C) ROC curve of HOXA1 in LUAD. (D) ROC curve of HOXA1 in LUSC. (E) Kaplan-Meier curves of HOXA1 expression in LUAD. Patients with high HOXA1 expression had a significantly poorer prognosis (75.15±9.68 months) compared with those with low expression (97.11±11.49 months). (F) Kaplan-Meier curves of HOXA1 expression in LUSC. Patients with high HOXA1 expression had a significantly better prognosis (71.05±4.81 months) compared with those with low expression (66.79±6.53 months). LUAD, lung adenocarcinoma; LUSC, lung squamous cell carcinoma; HOXA1, homeobox A1; ROC, receiver operating characteristic.

