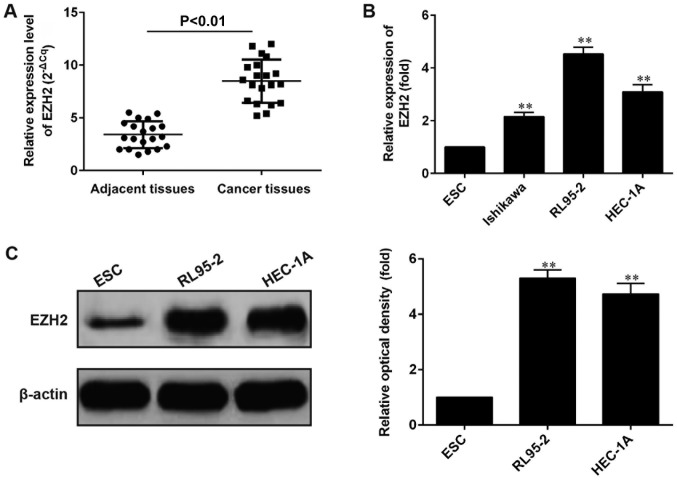
Figure 1.
Relative expression of EZH2 in endometrial cancer tissues and cell lines. (A) Relative EZH2 expression in endometrial cancer tissues (n=20) in comparison with the corresponding adjacent normal tissues (n=20; P<0.01). (B) Relative EZH2 expression in 4 endometrial cancer cell lines (Ishlkawa, RL95-2 and HEC-1A) in comparison with the normal endometrial cell line ESC. (A and B) EZH2 expression were examined by RT-qPCR and normalized to GAPDH expression. (C) The expression of EZH2 in the ESC, HEC-1A and RL95-2 cell lines was further examined by western blot analysis (right). The density of protein bands was quantified by using Image J software (left). Results shown are from 3 independent experiments. The ESC cell line was used as negative control. **P<0.01 vs. the negative group. EZH2, enhancer of zeste homolog 2; RT-qPCR, quantitative reverse transcription-polymerase chain reaction.

