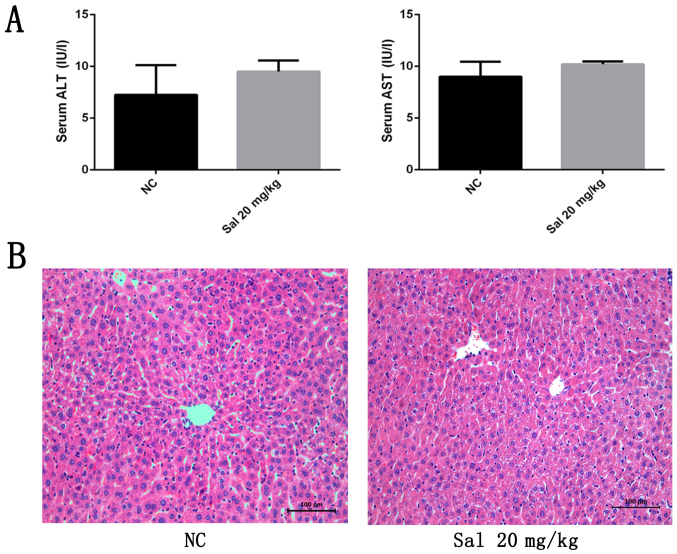
Figure 1.
Effects of Sal on liver function and pathology of healthy mice. (A) Serum ALT and AST levels. Data are presented as the mean + standard deviation (n=6). (B) Representative hematoxylin and eosin-stained sections of the liver (original magnification, ×200). NC, negative control; ALT, alanine aminotransferase; AST, aspartate aminotransferase; Sal, salidroside.

