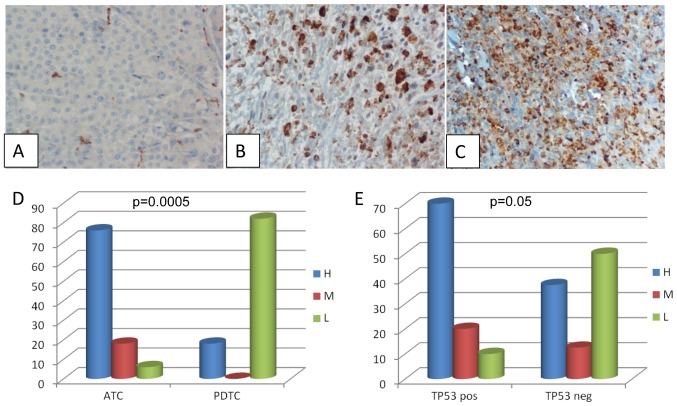
Figure 2.
TAM infiltration in ATC and PDTC. (A-C) Immunohistochemical detection of CD68 positivity showing different degrees of positivity (panel A, low; panel B, medium; panel C, high); (D) CD68 positive cases: comparison of the degree of positivity in the ATC and PDTC subgroups; (E) CD68 positive cases: Comparison of the degree of positivity in the TP53 positive and negative cases. TC, anaplastic thyroid cancer; PDTC, poorly differentiated thyroid cancer.

