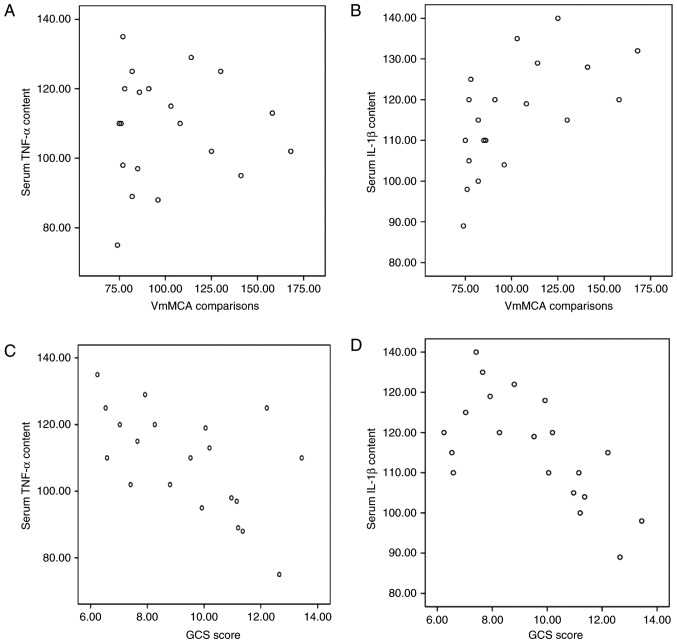
Figure 1.
Correlation analysis of serum TNF-α and IL-1β levels, VmMCA and GCS score. (A) Correlation analysis of TNF-α and VmMCA (r=0.38; P<0.05). (B) Correlation analysis of IL-1β and VmMCA (r=0.73; P<0.05). (C) Correlation analysis of TNF-α and GCS score (r=−0.89; P<0.05). (D) Correlation analysis of IL-1β and GCS score (r=−0.78; P<0.05). TNF, tumor necrosis factor; IL, interleukin; VmMCA, cerebral arterial blood flow velocity; GCS, Glasgow Coma Scale.

