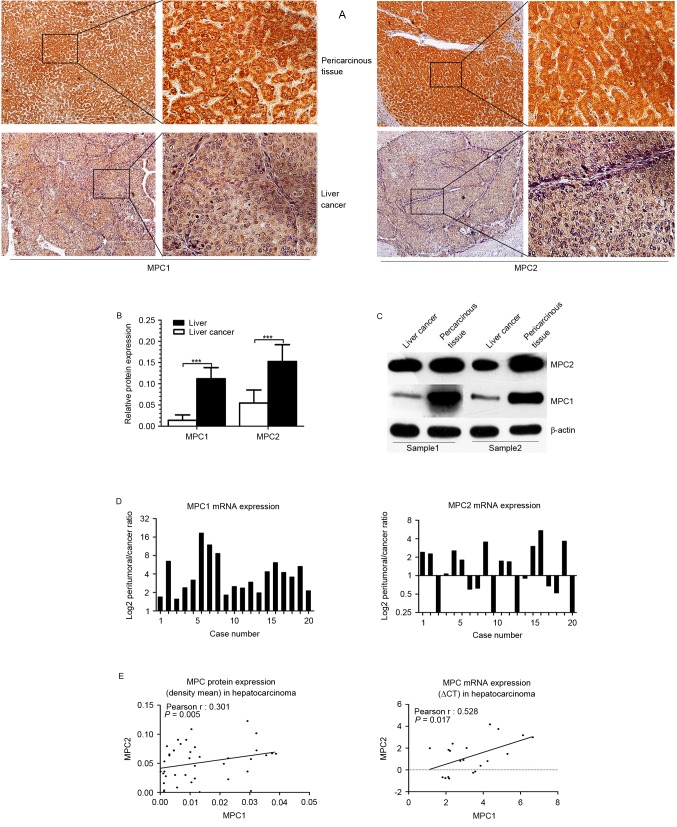
Figure 1.
Expression of MPC in HCC tissues and adjacent liver tissues. (A) Expression of MPC1 (left) and MPC2 (right) protein in HCC tissues vs. adjacent uninvolved tissue was analyzed by immunohistochemical staining. (B) Relative expression of MPC1 and MPC2 protein was calculated by the density mean. Error bars represent means ± standard deviation, ***P<0.001. (C) Western blot analysis of MPC1 and MPC2 in HCC samples and paired normal tissues. (D) Expression of MPC1 (left) and MPC2 (right) mRNA. Plotted bar represents the log2 mRNA expression ratio of non-cancerous tissue to tumor tissues. (E) Co-expression analysis for MPC1 in HCC vs. MPC2. Protein expression is represented by the density mean value (left) and mRNA expression is represented by ∆Cq (right). MPC, mitochondrial pyruvate carrier; HCC, hepatocellular carcinoma.

