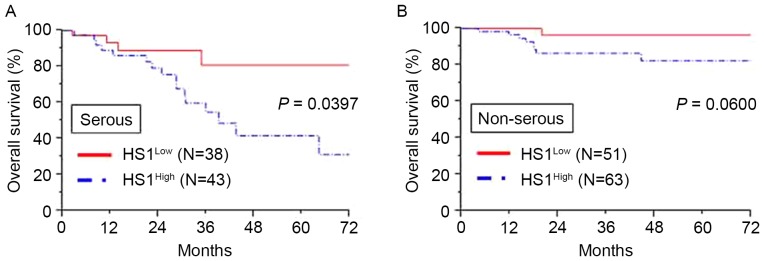
Figure 3.
(A) Kaplan-Meier overall survival curves for patients with serous EOC with regard to HS1 immunoexpression. The continuous line represents the low HS1 immunoexpression group (n=38), whereas the discontinuous line represents the high HS1 immunoexpression group (n=43). Patients with high HS1 expression demonstrated a significantly poorer overall survival rate compared with those with low HS1 expression (P=0.0397). (B) Kaplan-Meier overall survival curves for patients with non-serous EOC with regard to HS1 immunoexpression. The continuous line represents the low HS1 immunoexpression group (n=51), whereas the discontinuous line represents the high HS1 immunoexpression group (n=63). Overall, patients with high HS1 expression demonstrated a poorer overall survival compared with those with low HS1 expression, although this difference was not significant (P=0.0600). EOC, epithelial ovarian carcinoma; HS1, hematopoietic lineage cell-specific protein 1.

