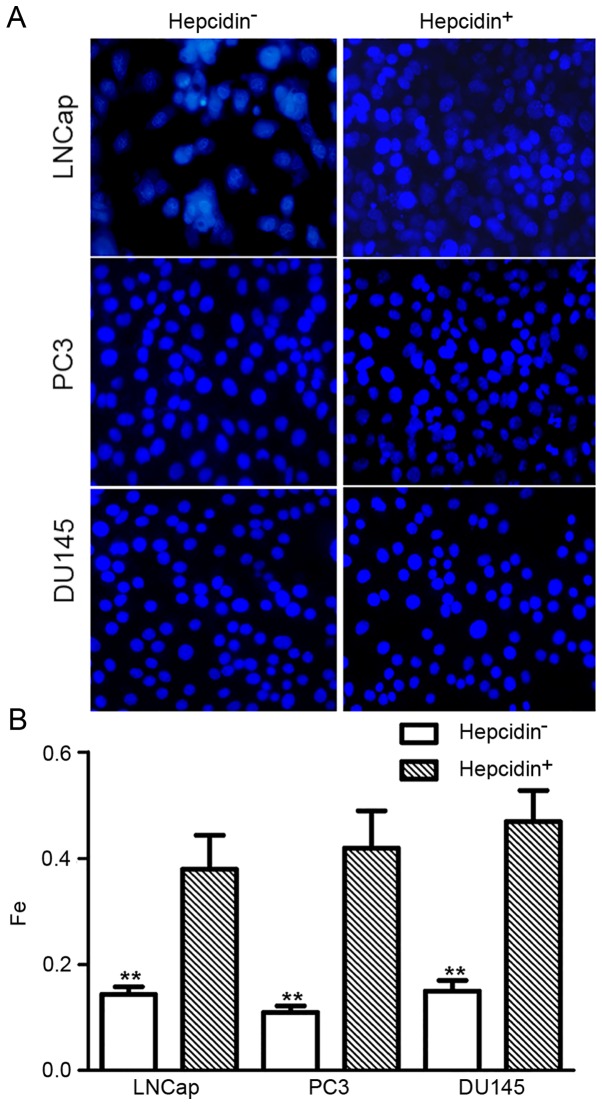
Figure 2.
Relative intracellular iron levels as determined by fluorescence intensity. Fluorescence intensity in the hepcidin+ve groups was significantly increased. (A) Fluorescence assay images and (B) data analysis results. **P<0.01 compared with the hepcidin+ve groups. Hepcidin+ve, cells treated with exogenous hepcidin.

