
Figure 2.
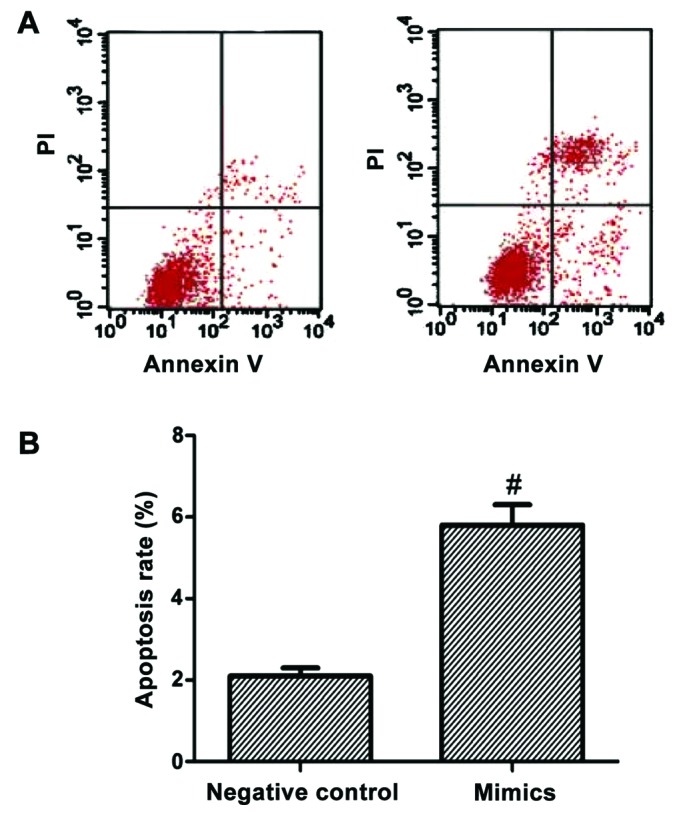
Changes in the apoptotic rate after cells were transfected using oligonucleotides. Compared with the negative control group, #p<0.05.
Official websites use .gov
A
.gov website belongs to an official
government organization in the United States.
Secure .gov websites use HTTPS
A lock (
) or https:// means you've safely
connected to the .gov website. Share sensitive
information only on official, secure websites.
Changes in the apoptotic rate after cells were transfected using oligonucleotides. Compared with the negative control group, #p<0.05.