Figure 3.

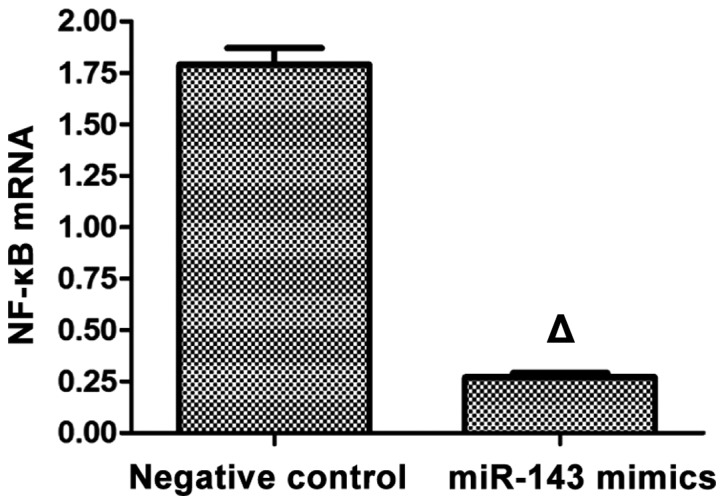
mRNA expression of NF-κB in the mimics and the negative control groups. Compared with the negative control group, ∆p<0.05.

mRNA expression of NF-κB in the mimics and the negative control groups. Compared with the negative control group, ∆p<0.05.