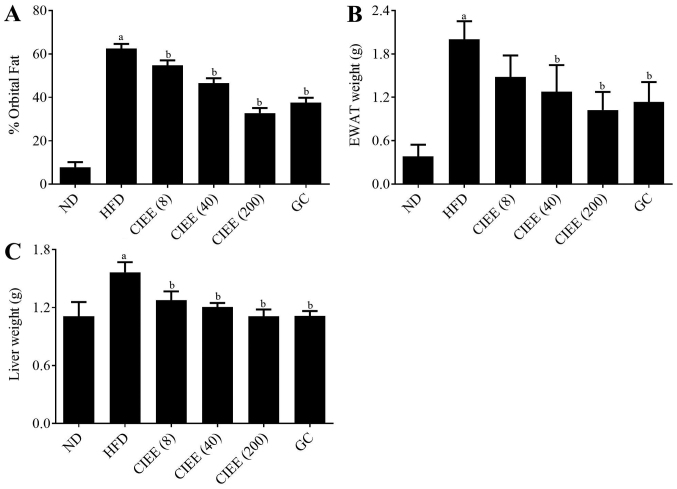
Figure 1.
Effect of CIEE on fat deposition in HFD fed mice. (A) Percentages of abdominal fat deposition determined by micro-CT analysis, (B) EWAT weight and (C) liver weight. Results are means ± SEM (n=6). aP<0.05 vs. ND group, bP<0.05 vs. HFD group. ND, normal diet group; HFD, high-fat diet group; CIEE, ethanol extract of Chrysanthemum indicum L.; GC, Garcinia cambogia: CT, computed tomography; EWAT; epididymal white adipose tissue;

