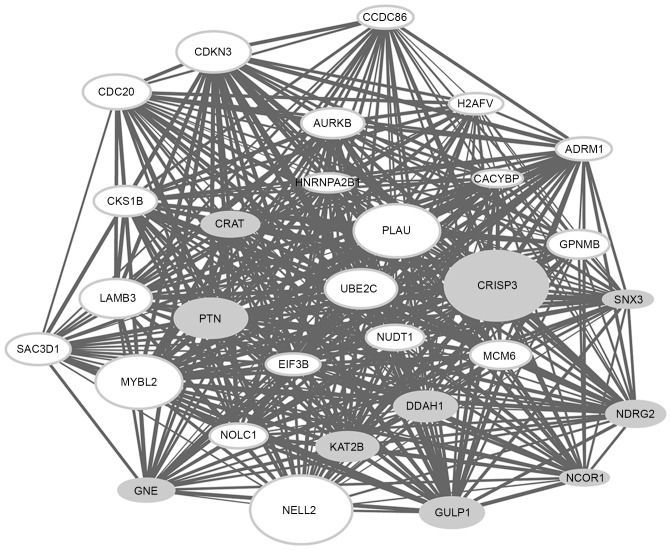
Figure 2.
Interaction network for the co-expression module ‘blue4’. The size of the nodes is proportional to the value of the |log2fold change|; gray nodes represent the downregulated genes and white nodes represent the upregulated genes. The width of the lines is proportional to the co-expression coefficient.

