Figure 4.
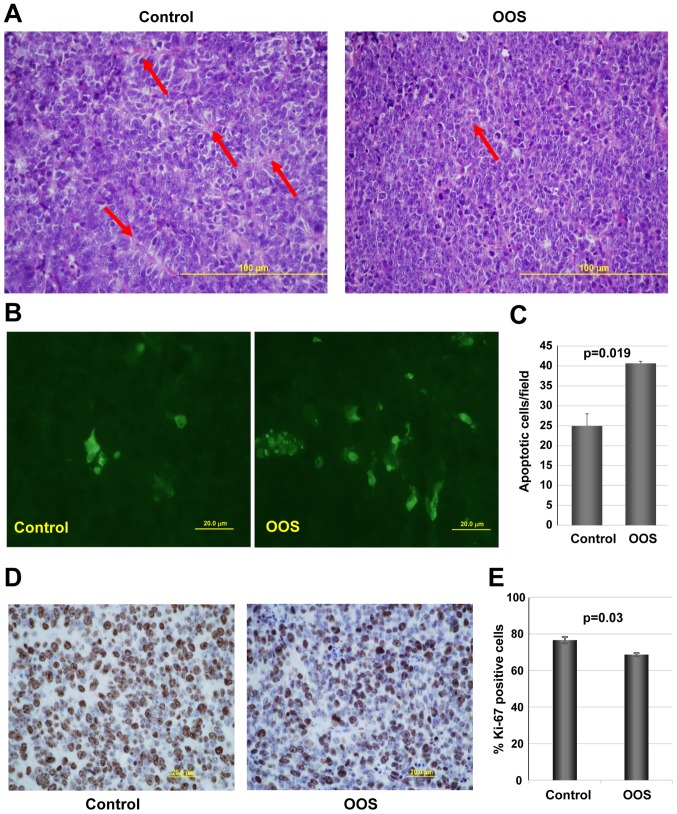
OOS induces an increase in cell death and a decrease in proliferation in vivo. At the time of sacrifice, part of the tumors from animals shown in Fig. 2 were fixed and included in paraffin for further analysis. (A) H&E staining of control (left panel) or OOS-treated (right panel) tumors. (B) OOS treatment causes an increase in intratumoral apoptotic cell death. For each experimental condition, two tumors were randomly processed for IHC analysis and apoptotic cells were detected by TUNEL staining. Images of representative fields stained for this marker are shown. (C) The number of apoptotic cells per field was quantified for each condition and its mean number ± SD is shown in the graph. (D) To establish the proliferative status of the tumors, Ki-67 marker was used and images of representative fields stained for Ki-67 are presented. (E) Quantification of the percentage of Ki-67-positive cells from (D). Statistical significant differences are shown (p<0.05). OOS, Ocoxin® oral solution.

