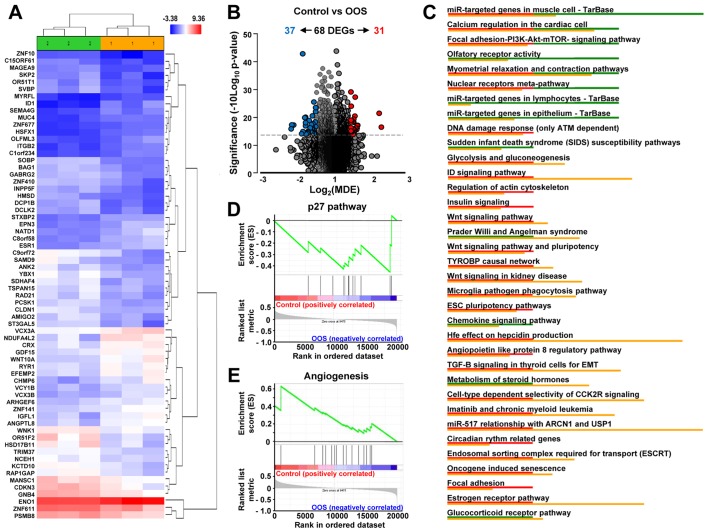
Figure 5.
In vivo effect of OOS on gene expression profiles. (A) Hierarchical clustering of the 6 tumors and the 68 genes deregulated after OOS treatment. Each row represents a gene and each column represents a tumor (1, control; 2, OOS-treated). The expression level of each gene in each tumor is relative to its medium abundance across all the tumors and is depicted according to the color scale shown. Red and blue indicate high or low expression levels, respectively. (B) Volcano plot representation of the deregulated genes found in the gene expression profiles. Blue plots represent the 37 genes upregulated in the control condition while red plots represent the 31 ones upregulated in the treated tumors. (C) Pathways in vivo deregulated after OOS treatment. Genes found to be deregulated at least 1.5-fold in the Affymetrix Expression Console were analyzed with the same software to evaluate the pathways in which gene expression is altered, and those pathways with a higher number of deregulated genes are shown in the figure. Below each altered pathway, genes upregulated in the control condition (red) or after OOS treatment (green) are shown. Upregulation of the p27 pathway (D) and downregulation of angiogenesis-related genes (E) upon GSEA analysis. OOS, Ocoxin® oral solution.

