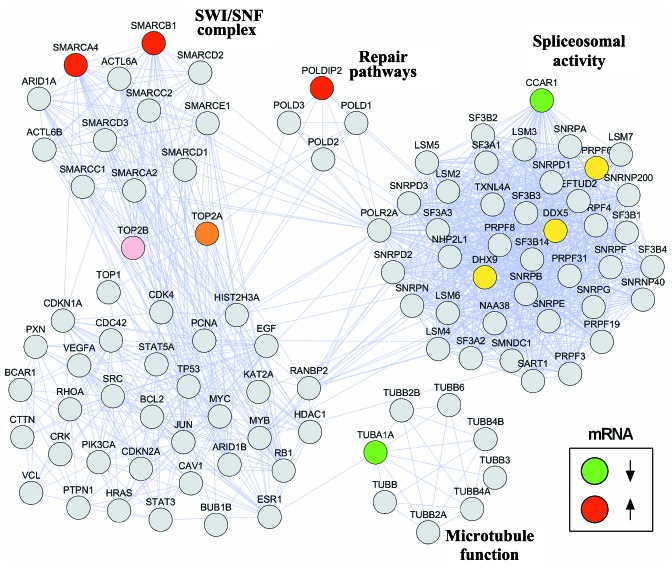
Figure 1.
Protein interaction network of genes involved in resistance to chemotherapy. Genes selected for this study are represented in red or green according to higher or lower relative mRNA expression, respectively, between control and chemoresistant Ewing sarcoma cells. DNA-topoisomerase (TOP)2A and TOP2B (pink/orange) were included due to their role as doxorubicin targets. Genes involved in spliceosomal activity and EWS/FLI1 activity are shown in yellow. The network was constructed using the STRING database, version 10.5.

