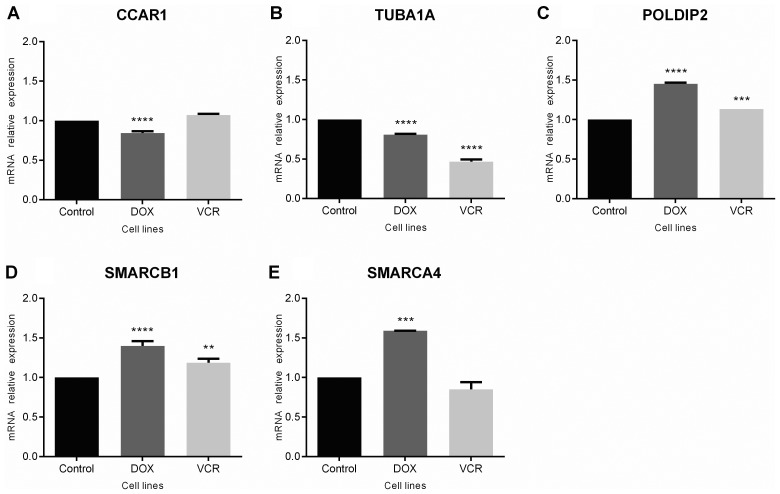
Figure 3.
Gene expression analysis of (A) CCAR1, (B) TUBA1A, (C) POLDIP2, (D) SMARCB1 and (E) SMARCA4 in chemoresistant and non-resistant SK-ES-1 Ewing sarcoma cells. Values represent the relative expression of genes in doxorubicin (DOX)-resistant, vincristine (VCR)-resistant, and control SK-ES-1 cells (cell lines); **P<0.005; ***P<0.0005; and ****P<0.0001 compared with control cells.

