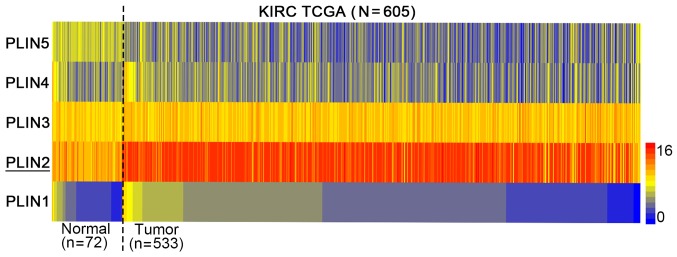
Figure 1.
Heat map depicting PLIN expression in samples from TCGA combined human clear cell renal cell carcinoma microarray datasets (n=605). Red indicates high expression; yellow indicates medium expression; blue indicates low expression. KIRC, kidney renal clear cell carcinoma; PLIN, perilipin; TCGA, The Cancer Genome Atlas.

