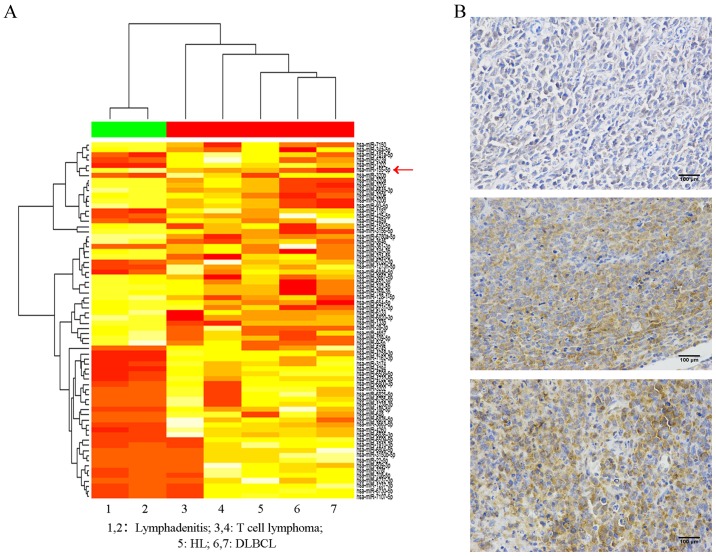
Figure 1.
Lymphoma tissue data. (A) A total of 70 miRNAs were detected by microarray in lymphadenitis and lymphoma tissues. Red represents high expression and yellow represents low expression. The miRNA expression variation among the 7 tissues was evaluated by cluster analysis. The expression of miR-155 is labeled with a red arrow. (B) Immunohistochemical analysis of tissues from three lymphoma patients (scale bars, 100 µm). miRNA/miR, microRNA; DLBCL, diffuse large B cell lymphoma; HL, Hodgkin lymphoma.

