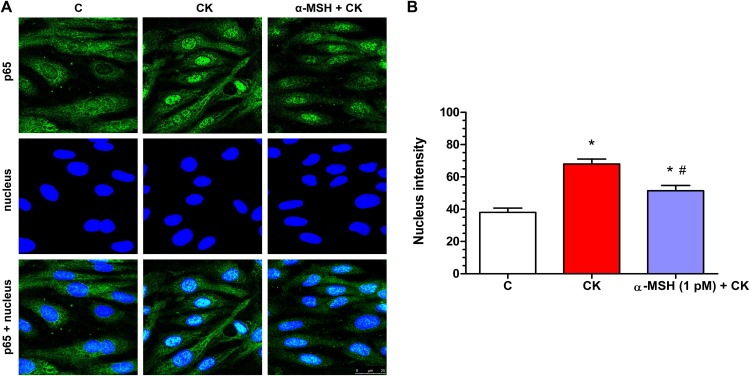
Figure 7. Immunohistochemical staining and analysis of NF-κB activation in cytokine- and α-MSH-treated brain endothelial cells.
(A) Rat brain endothelial cells were treated with culture medium, cytokines (10 ng/ml TNF-α and 10 ng/ml IL-1β), or cytokines and 1 pM α-MSH. Nuclear localization of the NF-κB p65 subunit was monitored by immunostaining. Cell nuclei were labeled with Hoechst 33342. Green: p65 staining; blue: cell nuclei. Scale bar: 25 μm. (B) Fluorescence intensity of the NF-κB immunostaining in cell nuclei and cytoplasm. Mean ± SEM, n = 20–28, *P < 0.05, #P < 0.05. *: CK, CK + MSH compared to C; #: CK + MSH compared to CK. C, control group; CK, cytokine treated group; α-MSH + CK, α-MSH and cytokine treated group.

