
Figure 3.
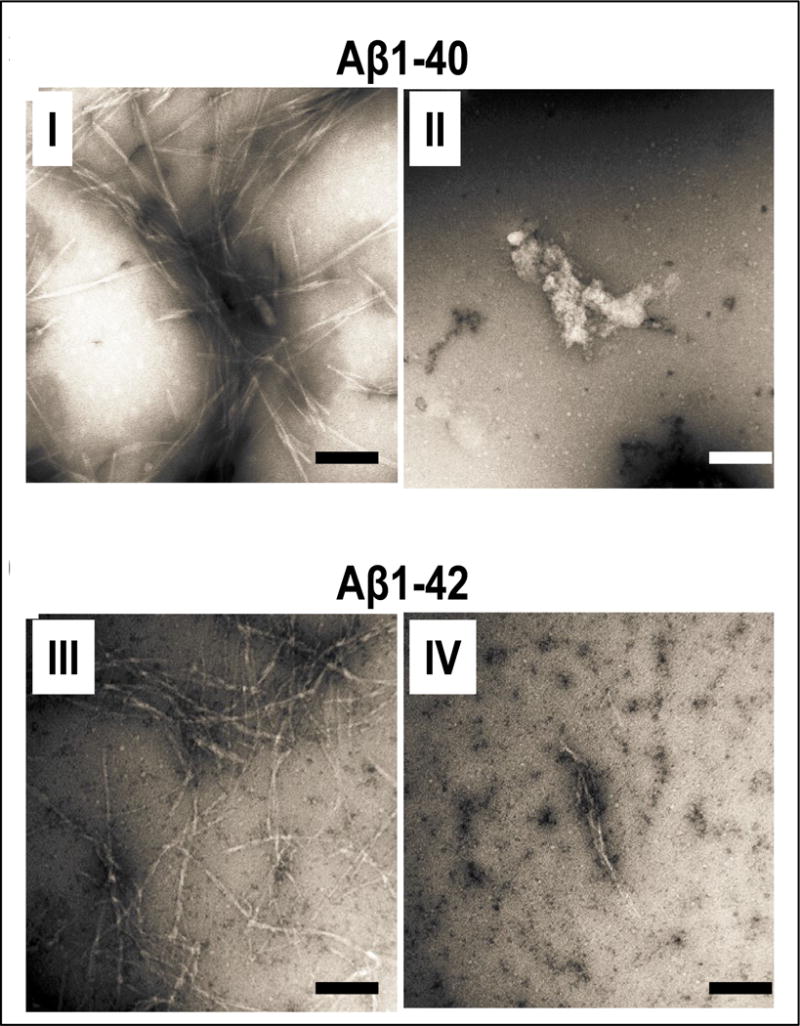
Assessments of Aβ protofibril morphology. (Panels I, II, III, IV) EM was used to determine the morphologies of protofibrils obtained by the incubation of Aβ1-40 (panels I and II) or Aβ42 (panels III and IV), in the presence of vehicle (panels I and III) or valeric acid at a valeric acid:Aβ molar ratio of 4:1 (panels I and IV). Shown are representative assays from three independent studies. Scale bars indicate 100 nm.