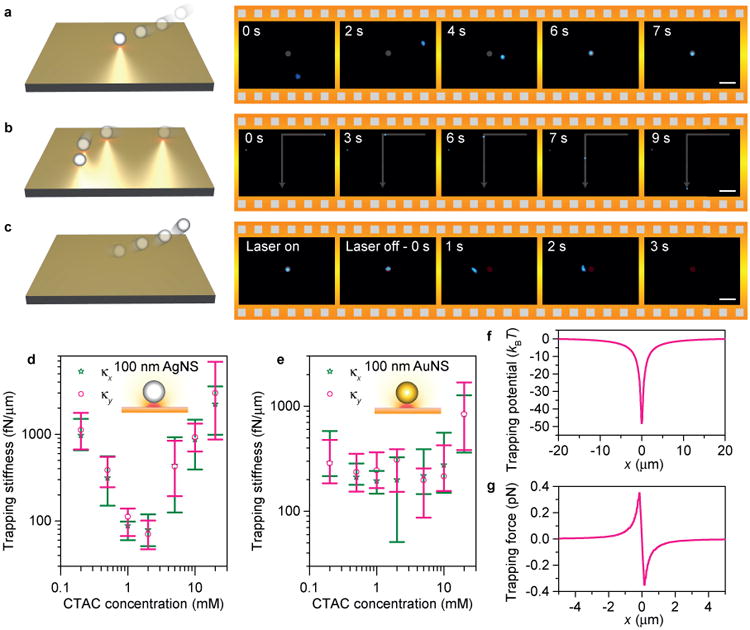
Figure 2. Single-nanoparticle trapping and manipulation.

Schematic illustration and successive optical images showing a, trapping b, dynamic manipulation, and c, release of a single 100 nm AgNS. The grey disks and the red disks mean that the laser is turned on or turned off, respectively. The grey lines show the manipulation trajectory of the trapped AgNS. Measured trapping stiffness of single d, 100 nm AgNSs and e, 100 nm AuNSs as a function of CTAC concentration. κx and κy are the trapping stiffness along x and y axis, respectively. The error bars show the deviation in multiple measurements with different particles. f, Trapping potential and g, trapping force of a single 100 nm AgNS at CTAC concentration of 20 mM. The laser has a wavelength of 671 nm and an optical power of 0.4 mW in d-g. Scale bars: 10 μm (a, c) and 20μm (b).
