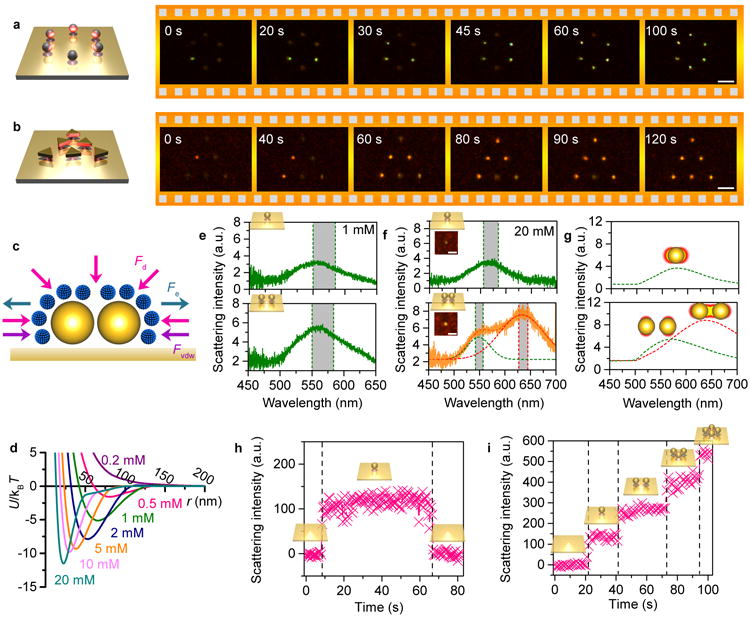
Figure 4. Parallel and multiple trapping via OTENT.

Parallel trapping of a, six 100 nm AgNSs into a circular pattern, and b, six 140 nm AuNTs into a triangular pattern. c, Interaction forces between two trapped nanoparticles. d, Calculated interaction potential between two AuNSs at different CTAC concentrations. Scattering spectra of a single AuNS (top) and two AuNSs (bottom) in e, 1 mM and f, 20 mM CTAC solution. g, Simulated scattering spectra of a single AuNS (top) and two AuNSs (bottom) in 20 mM CTAC solution. The red and green dashed curve represent the longitudinal and transverse plasmon mode, respectively (f and g). Trapping dynamics of h, a single AuNS and i, multiple AuNSs in 1 mM CTAC solution. The grey rectangles represent the peak distributions recorded in multiple experiments. The particle diameter is 100 nm in d-i. Scale bars: 5μm (a, b) and 2 μm (f).
