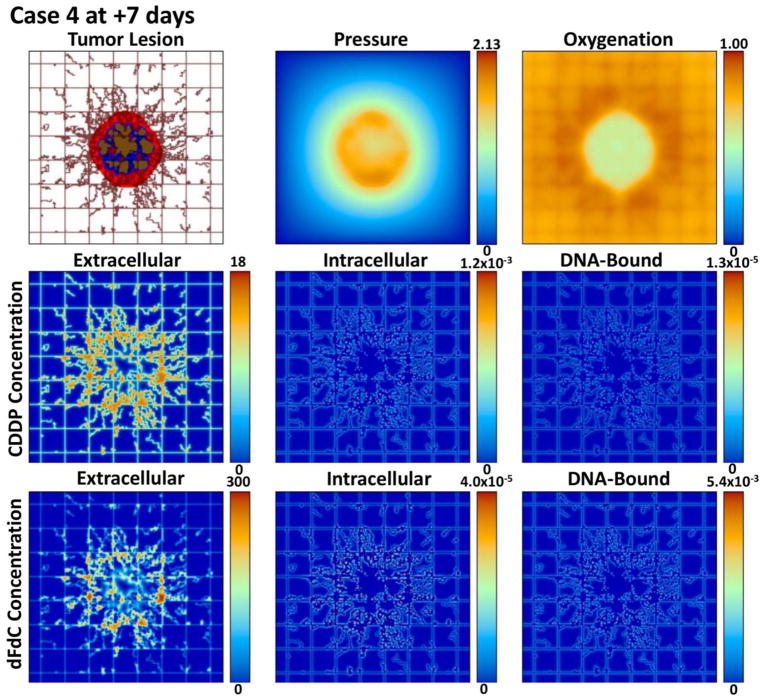
Figure 5.
Case 4 (metronomic CDDP and dFdC) after 7 days post treatment initiation. The drug concentrations are shown for the extracellular (μM), intracellular (fMoles/cell), and DNA-bound (fMoles/cell) compartments as defined at this timepoint by the corresponding pharmacokinetic equations. While the proliferation region is comparable to day 1, the overall tumor is smaller. The dFdC extracellular concentration reflects the second dose at this timepoint.

