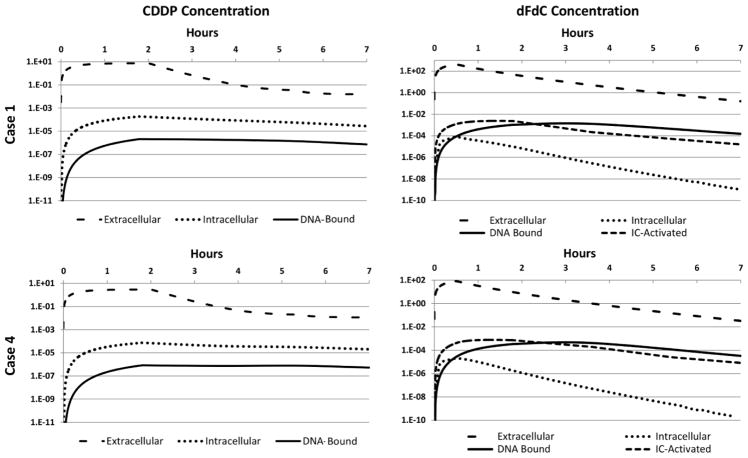
Figure 6.
Average concentrations of CDDP (left column) and dFdC (right column) over 7 hours following treatment initiation for Cases 1 (top row) and 4 (bottom row). Values are shown for the extracellular (μM), intracellular (fMoles/cell), DNA-Bound (fMoles/cell), and intracellularly-activated (IC-Activated, specific to dFdC) (fMoles/cell) compartments. Note that Cases 2 and 3 combine these same concentrations, as specified in Table 6.

