Figure 6.

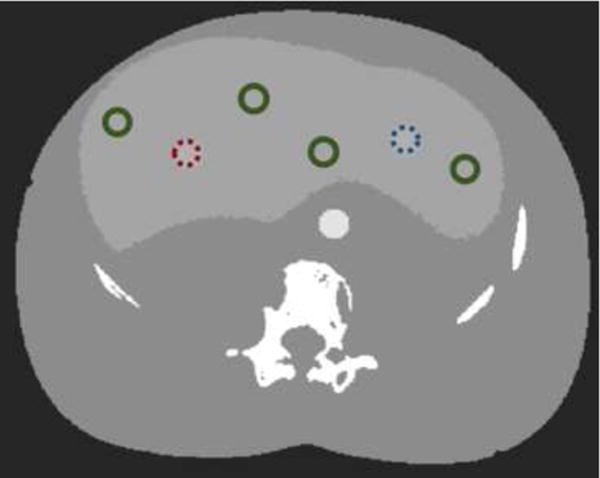
ROIs for TAC and perfusion RMSE calculation. The ROI for the homogeneous and Gaussian tumors are marked in dotted red (left) and dotted blue (right) respectively and other circles show healthy liver tissue with green.

ROIs for TAC and perfusion RMSE calculation. The ROI for the homogeneous and Gaussian tumors are marked in dotted red (left) and dotted blue (right) respectively and other circles show healthy liver tissue with green.