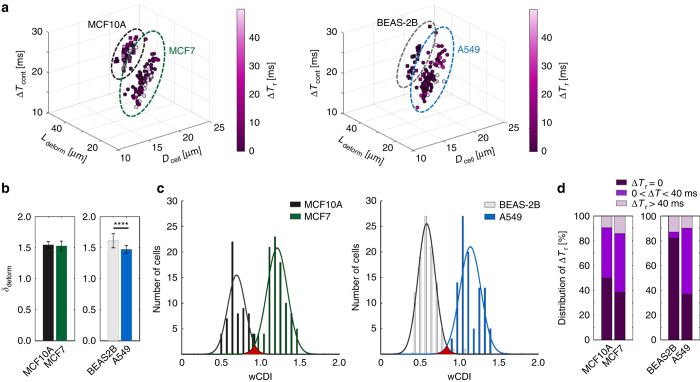
Figure 2.
Mechanical phenotyping of malignant and non-malignant epithelial cells. (a) 4D plot of the free cell diameter (Dcell), elongation length (Ldeform) due to an applied strain ε~0.3, transit time through the contraction channel (ΔTcont), and recovery time from compressive deformation (ΔTr) of malignant (MCF-7, n=99) and non-malignant (MCF-10A, n=99) breast cells, and malignant (A549, n=100) and non-malignant (BEAS-2B, n=100) lung cells. Dotted ovals group each cell line (MCF-10A: black, MCF-7: green, BEAS-2B: gray A549: blue). (b) Transverse deformation (δdeform) of MCF-10A, MCF-7, BEAS-2B, and A549 cells. Statistical differences were determined by a paired t-test (****P⩽0.0001). (c) wCDI distribution of MCF-10A, MCF-7, BEAS-2B, and A549 cells. Statistical differences were determined by a paired t-test. (MCF-10A vs MCF-7: P=3.90e-58, BEAS-2B vs A549: P=1.10e−80). The solid lines correspond to the fitted normal wCDI distribution for malignant and non-malignant cells, respectively. MCF-10A: ; MCF-7: ; BEAS-2B: ; and A549: . (d) The proportion of cells screened that recovered instantaneously (ΔTr~0), required 40 ms or less (0<ΔTr⩽40 ms), or did not recover within the window of time measured (ΔTr>40 ms). A Chi-square test was employed to determine the statistical differences between the proportions of cell recovery types. There was no statistical difference in recovery types between MCF10A and MCF7 cells. In contrast, there was a significant statistical difference between BEAS-2B and A549 cells regarding instantaneous recovery (P⩽0.0001) and transient recovery (P⩽0.0001).

