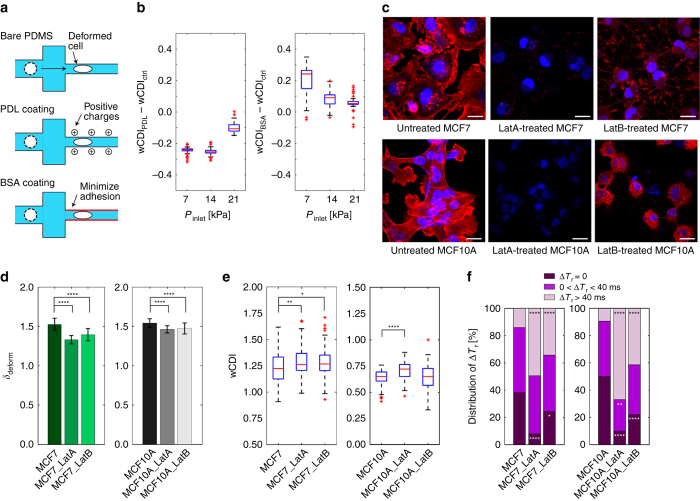
Figure 3.
Contribution of cell-surface interaction and cytoskeletal component, F-actin, to the mechanical phenotypes of epithelial cells. (a) Schematic of experimental conditions used to measure the effects of cell-surface interaction on the wCDI. While poly-D-lysine (PDL) increases the positive charges on the channel wall for increased cell-surface interaction, bovine serum albumin (BSA) minimizes cellular adhesion to the channel wall. The control for all experiments was bare PDMS. (b) The difference in wCDI measured when MCF-7 cells transit a bare PDMS contraction channel (control) and a PDL-coated channel or a BSA-coated channel (n=99 for all cases) under various fluidic conditions. The difference in wCDI becomes smaller with greater Pinlet. Within each box, the central red line corresponds to the median, and the edges of the box to 25% and 75% of the population. (c) Fluorescence images of MCF-7 and MCF-10A cells after treatment with Latrunculin A (LatA, 5 μg mL−1, 1 h) or Latrunculin B (LatB, 5 μg mL−1, 1 h). Cell nuclei and F-actin are stained with 4ʹ,6-diamidino-2-phenylindole (DAPI, blue) and rhodamine Phalloidin (red), respectively. Scale bar corresponds to 20 μm. (d) Transverse deformation (δdeform) of untreated, LatA-, and LatB-treated MCF7 and MCF10A cells (n=99). Statistical differences were determined by a paired t-test. (e) wCDI distribution of MCF-7 (n=99, Ctrl vs LatA: P=0.0074, Ctrl vs LatB: P=0.0253) and MCF-10A cells (n=99, Ctrl vs LatA: P=4.8940e-7, Ctrl vs LatB: P=0.9758), in which cells were either untreated or treated with LatA or LatB. Statistical differences were determined by a paired t-test. Within each box, the central red line corresponds to the median, and the edges of the box to 25% and 75% of the population. (f) The proportion of untreated and treated MCF-7 and MCF-10A cells screened that recovered instantaneously (ΔTr~0), required 40 ms or less (0<ΔTr⩽40 ms), or did not recover within window time measured (ΔTr>40 ms). The statistical differences between the proportions of recovery types of untreated and treated cells were evaluated by a Chi-square test. For all graphs, *, **, ***, and **** indicate P⩽0.05, P⩽0.01, P⩽0.001, and P⩽0.0001, respectively.

