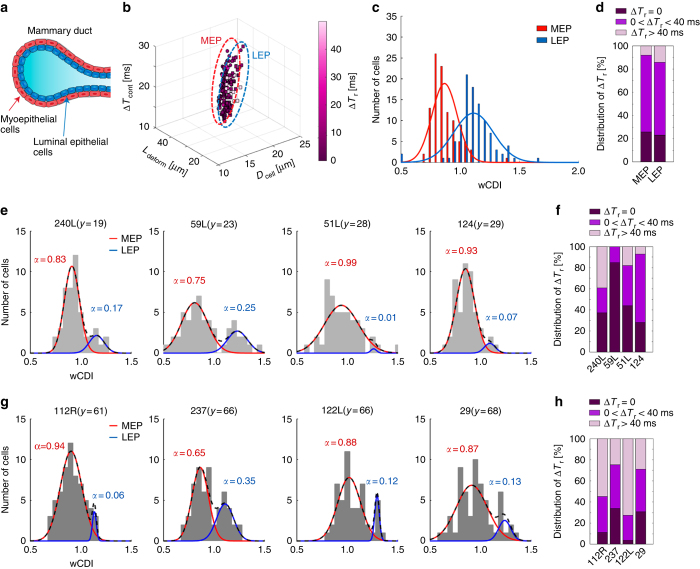
Figure 4.
Mechanical phenotyping of HMECs. (a) Cellular structure of the human mammary gland. The mammary duct consists of an outer layer of myoepithelial cells (red) that surround an inner layer of luminal epithelial cells (blue). (b) 4D plot of the cell diameter (Dcell), elongated length (Ldeform), transit time through the contraction channel (ΔTcont), and recovery time (ΔTr) of myoepithelial (MEP, n=99) and luminal epithelial (LEP, n=104) breast cells. Dotted ovals group each sub-lineage (MEP: red and LEP: blue). Pre-sorted MEP and LEP cells were screened with an applied strain magnitude ε~0.4. (c) wCDI distributions of MEP and LEP lineages (P=1.2047e-25). Statistical differences were determined by a paired t-test. The red and blue lines correspond to the fitted normal distribution of MEP () and LEP () cells, respectively. The wCDI overlap between the two lineages is 29.3%. (d) Distribution of pre-sorted MEP and LEP cells that have instant (ΔTr ~0,), transient (0<ΔTr⩽40 ms), or prolonged (ΔTr>40 ms) recovery. (e and g) wCDI distribution of HMECs derived from young (e, y=age, 240L; n=54, 59L; n=53, 51L; n=50, 124; n=54) and old women (g, 112R; n=62, 237; n=59, 122L; n=54, 29; n=60). Outliers over 3 standard deviation of the mean were removed. The black dashed line corresponds to the fitted normal distribution of HMEC cells (MEP+LEP). The red and blue solid lines represent the normal distribution of MEP and LEP cells, respectively, with the ratio (α) of each lineage in the HMEC population as determined by the Expectation-Maximization algorithm77. (f and h) The proportion of HMECs from young (e) and old (g) women that have instant, transient, or prolonged recovery from applied strain.

