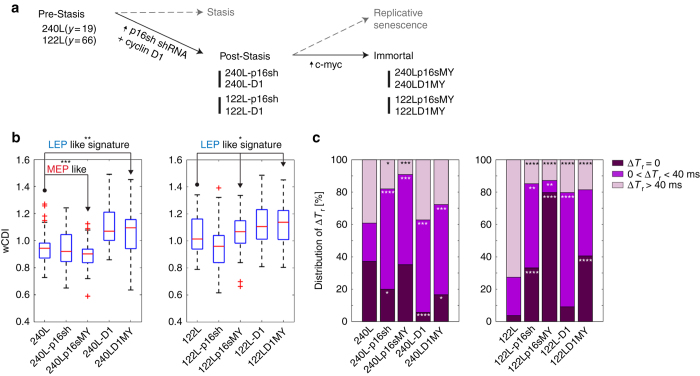
Figure 5.
Mechanical phenotyping of HMECs undergoing immortalization. (a) The stages of malignant progression in breast epithelia. (b) wCDI distribution of HMECs per the outlined immortalization steps when cells were screened with an applied strain of ε~0.4 (n=54 for all cases) Compared to primary cells (240L and 122L, respectively), each population has following P values, 240L-p16sh: P=0.5306, 240Lp16sMY: P=0.0003, 240L-D1: P=0.0005, 240LD1MY: P=0.0094, 122L-p16sh: P=0.0205, 122Lp16sMY: P=0.5668, 122L-D1: P=0.023, and 122LD1MY: P=0.011. Statistical differences were determined by a paired t-test. Within each box, the central red line is the median, the red cross is an outlier, and the edges of the box correspond to 25 and 75% of the population. (c) Distribution of instant (ΔTr~0,), transient (0<ΔTr⩽40 ms), or prolonged (ΔTr>40 ms) recovery within each HMEC population per immortalization step. The statistical differences between the proportions of recovery types of primary cells and each stage of malignant progression were evaluated by a χ2 test. For all graphs, *, **, ***, and **** indicate p⩽0.05, p⩽0.01, p⩽0.001, and p⩽0.0001, respectively.

