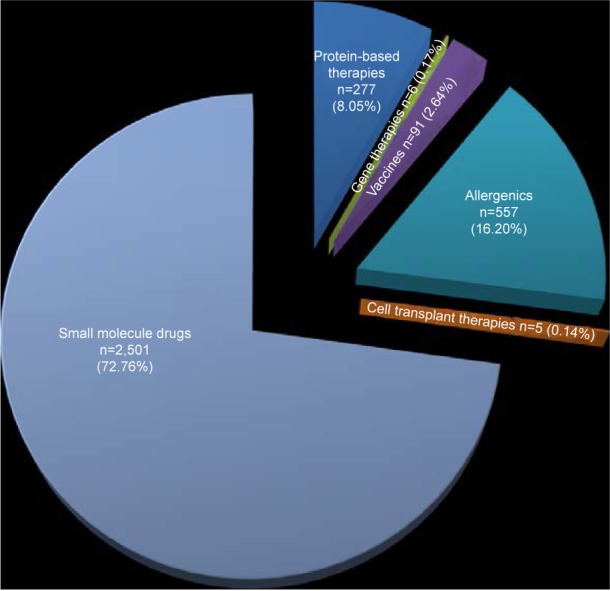
Figure 3.

A summary of the FDA-approved small- and large-molecule therapeutics.
Notes: Number and percentage of FDA-approved therapeutics (in 2018) is shown inside the pie diagram. Protein-based therapies: 8.05% (n=277), gene and nucleic acid-based therapies: 0.17% (n=6), vaccines: 2.64% (n=91), allergenics: 16.20% (n=557), cell transplant therapies: 0.14% (n=5), small-molecule drugs: 72.76% (n=2,501).
Abbreviation: FDA, US Food and Drug Administration.
