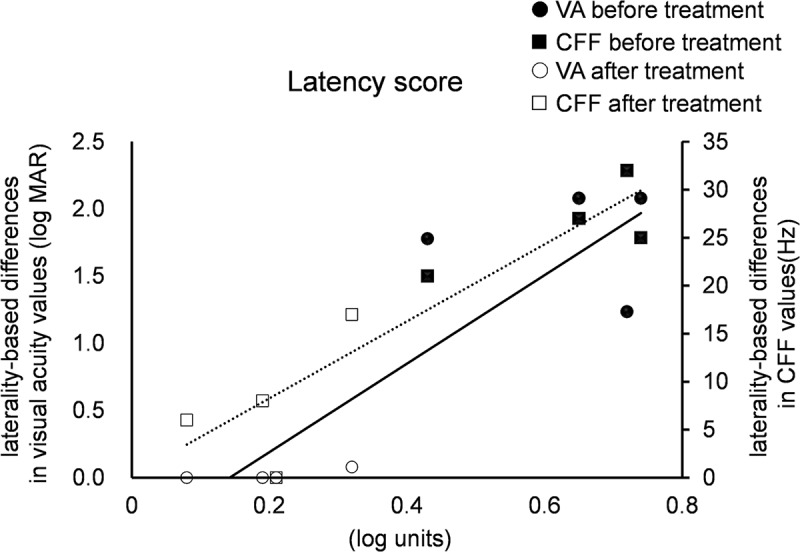
Figure 3.

Correlations with latency score and the laterality-based differences in visual acuity and CFF values. VA: visual acuity; CFF: critical flicker fusion frequency. p value was <0.01 and correlation coefficient was 0.86 with CFF. p value was 0.01 and correlation coefficient was 0.86 with CFF. Solid line: VA; dotted line: CFF.
