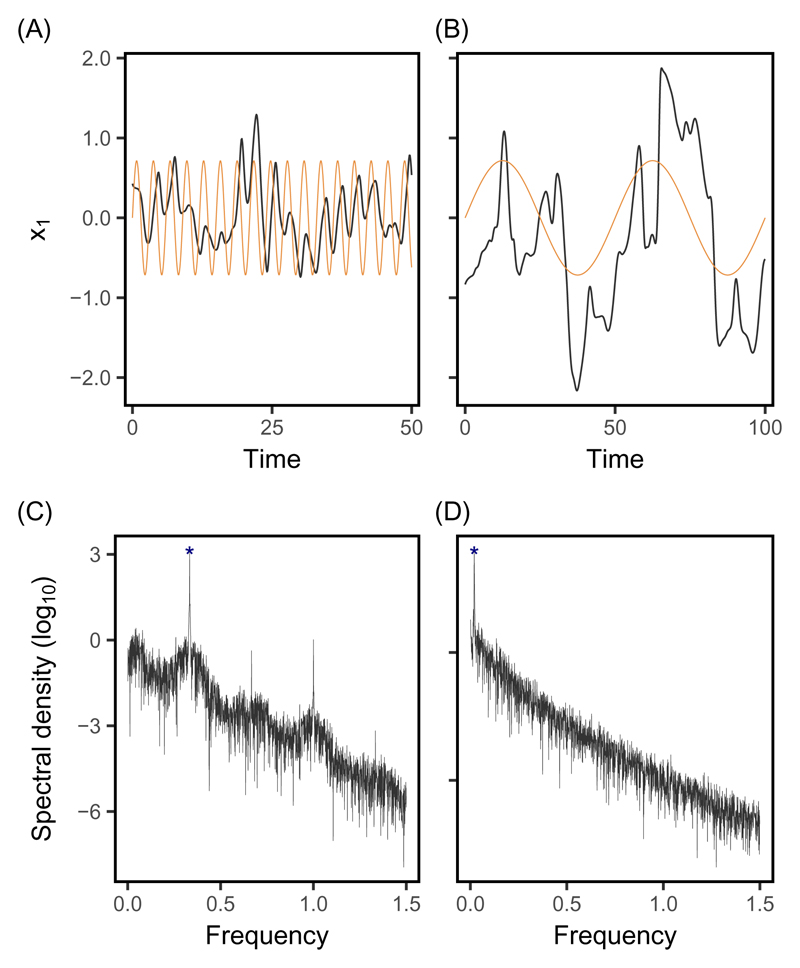
Fig. 3.
Chaotic evolutionary dynamics in changing environments. Chaotic evolutionary trajectories (black in A and B) combine internally driven chaos with external environmental forcing through tracking of the optimum. Chaotic oscillations can be either (A) longer or (B) shorter than the oscillations of the optimum (shown in orange), depending on the periods of the latter (3 and 50, respectively). (C, D) Spectral analysis of these same time-series of evolving phenotype (using all traits as described in the Methods) show a peak of spectral density (blue star) at the frequency of oscillation that corresponds to the oscillating optimum.

