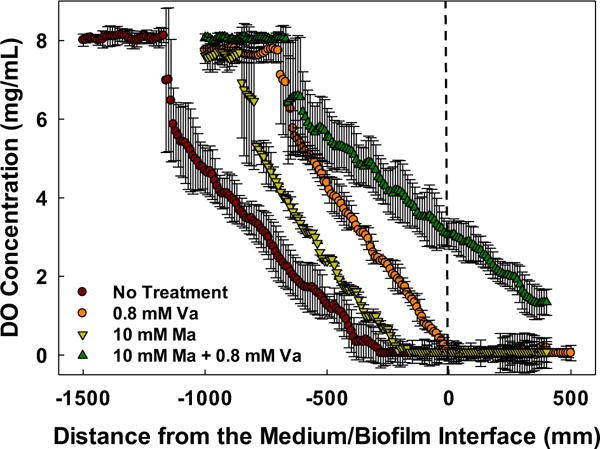
FIGURE 2.

Dissolved oxygen profiles inside S. aureus biofilms. The dashed lined (distance 0 mm) on the x-axis depicts the approximate surface of the biofilm. Like the control, biofilms treated with vancomycin (Va) or maltodextrin (Ma) showed DO concentrations below the detection limit (0.0032 mg/L). Data are means and error bars are standard deviation of at least two biological replicates
