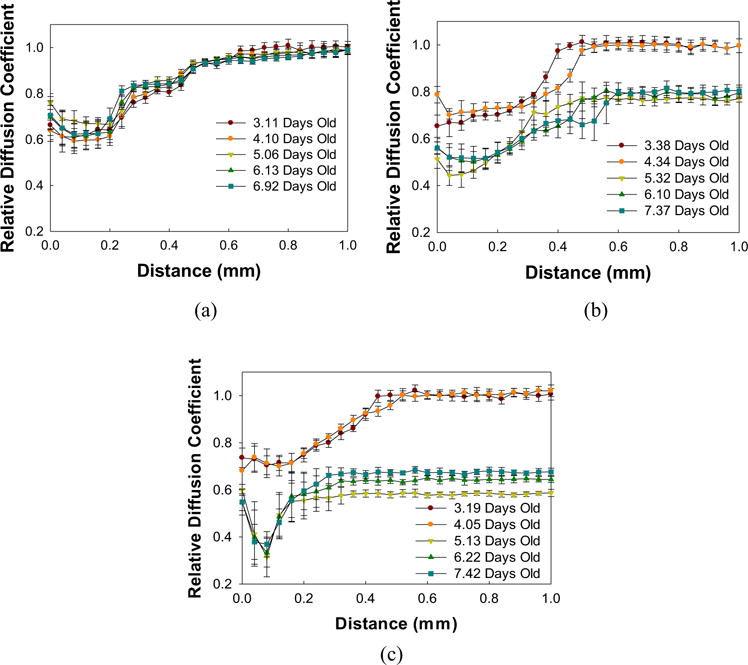
FIGURE 6.

Relative diffusion coefficient depth profiles of S. aureus biofilms treated with (a) vancomycin, (b) maltodextrin, or (c) a combination of the two. Treatments were administered after 5 days of biofilm growth. Data are means and error bars are standard deviation which represents heterogeneity at each depth within each layer of the biofilm
