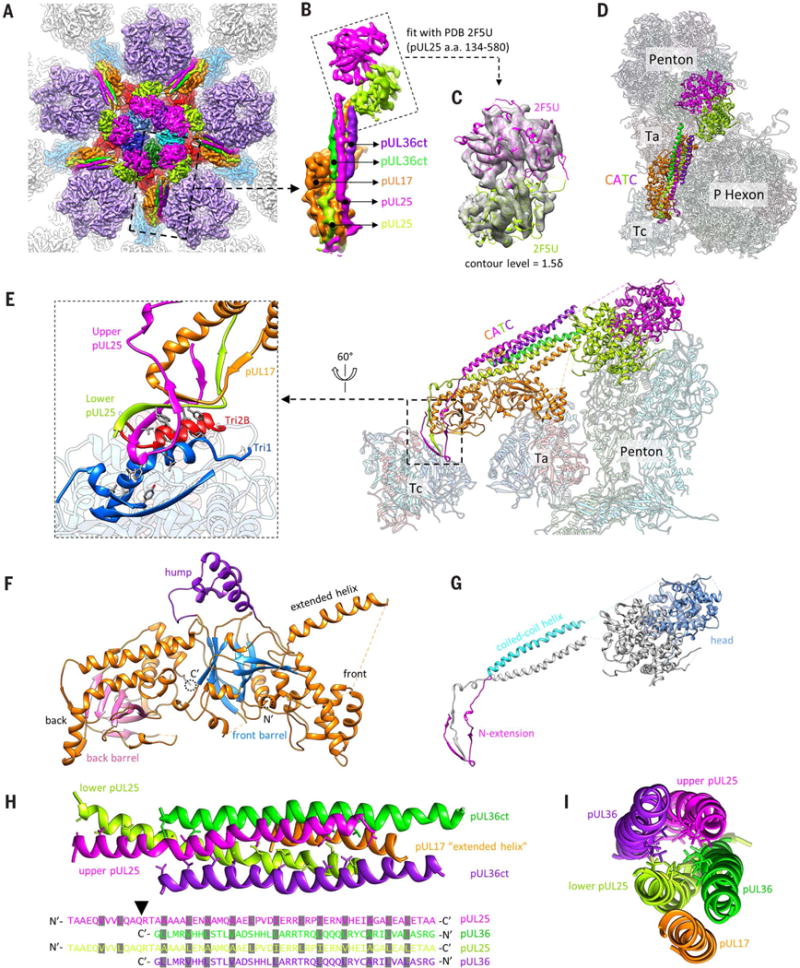
Fig. 2. Structure of the CATC.

(A) Cryo-EM densities of the CATC surrounding a penton vertex. The density map was low-pass filtered to 6-Å resolution to show the flexible pUL25 head region. (B) Magnified view of a segmented-out CATC unit from the dashed square in (A), showing its composition. (C) Fitting of two copies of pUL25 C-terminal region crystal structure (PDB 2F5U) (22) into the bi-lobed head region of CATC. The contour level for the pUL25 head region in (A) to (C) was 1.5d (where d is the standard deviation) and that of the rest was 3d. (D and E) Top view (D) and side view (E) of CATC interacting with underlying capsid components, shown with atomic models. On the left in (E) is a magnified view of the interface between the CATC and triplex Tc. Hydrophobic side chains of the pUL25 dimer, Tri1, and Tri2B involved in the interactions are highlighted. (F and G) Domain organization of pUL17 (F) and pUL25 (G). (H and I) The five-helix bundle viewed from the top of the capsid (H) or along the center of the coiled coil (I). In (H), side chains are shown for hydrophobic residues in the center of the helix bundle (top), with their identities marked (grayed) in the sequence (bottom). The arrowhead in (H) points to the position in the pUL25 sequence where the hydrophobic residue distribution pattern breaks. Nʹ, N terminus; Cʹ, C terminus.
