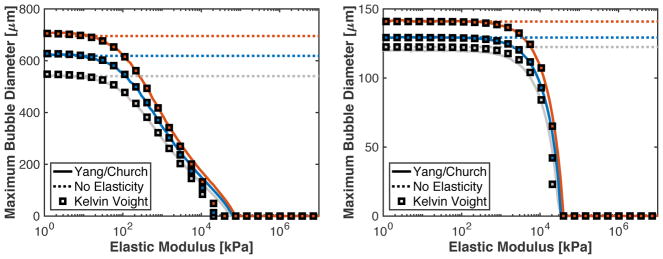
Fig. 4.
(A) Predicted maximum bubble size as a function of elastic modulus for microtripsy pulses with 24.9 (gray), 29.3 (blue), and 33.6 MPa (red) peak negative pressures. (B) Predicted maximum bubble size as a function of elastic modulus for a single cycle shock-scattering histotripsy pulse with peak negative/peak positive pressures of 14.5/88.9 (gray), 15.8/98.8 (blue), and 18.3/107.0 MPa (red) peak negative/peak positive pressures. For both panels, the solid line is the numerical computations with the Yang/Church model with Kelvin-Vought elasticity, the dotted line is the analytic model without elasticity incorporated, and squares are the analytic theory with Kelvin-Voight elasticity incorporated.

