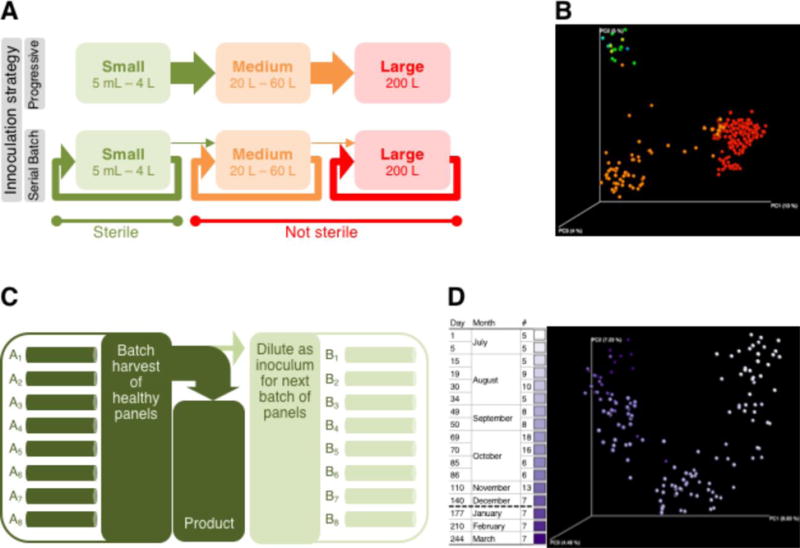
Figure 1. Overview of bacterial communities in N. salina growth systems.

(A & B) Bacterial communities differ across growth scales
(A) Serial batch inoculation strategy of N. salina cultivation systems contrasted with a progressive inoculation strategy. Growth systems are categorized as small, medium or large as illustrated and further described in the text. Shading of system sizes corresponds to coloring in Fig. 1B. Arrow intensities indicate relative movement of inoculum biomass within and between systems.
(B) Principal coordinates analysis plot showing relationships among bacterial communities isolated from algae growth systems. Each point represents the bacterial community isolated in a single sample. Colors indicate samples from small (multi-color, blue–yellow spectrum), medium (orange), and large (red) cultivations.
(C & D) Relationships among bacterial communities in replicate 200-L N. salina cultivations grown in outdoor systems using a serial batch inoculation strategy
(C) Schematic representation of serial batch inoculation strategy for 200-L cultivations in large growth systems. Algae were grown to maturity in individual 200-L cultivations before being harvested in batch. The majority of the harvest was used for product extraction. A portion of the batch harvest was diluted and used to inoculate subsequent replicate panels of algae cultivation.
(D) Principal coordinates analysis plot showing 135 bacterial communities isolated from large N. salina growth systems during a 9-month period. Each point represents the bacterial community in a single sample. Day, day relative to start of experiment; Month, month of sampling day; #, number of large system samples analyzed
