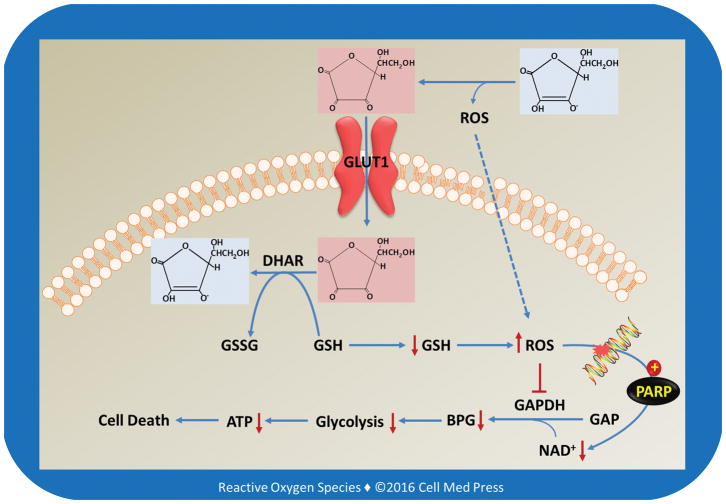
FIGURE 4. Schematic illustration of the molecular and cellular pathways involved in high-dose vitamin C-mediated selective cytotoxicity to cancer cells that both overexpress GLUT1 and have become addicted to glycolysis for energy production.
GAP and BPG denote glyceraldehyde 3-phosphate and 1,3-bisphosphoglycerate, respectively. This scheme is based on Ref. [4].

