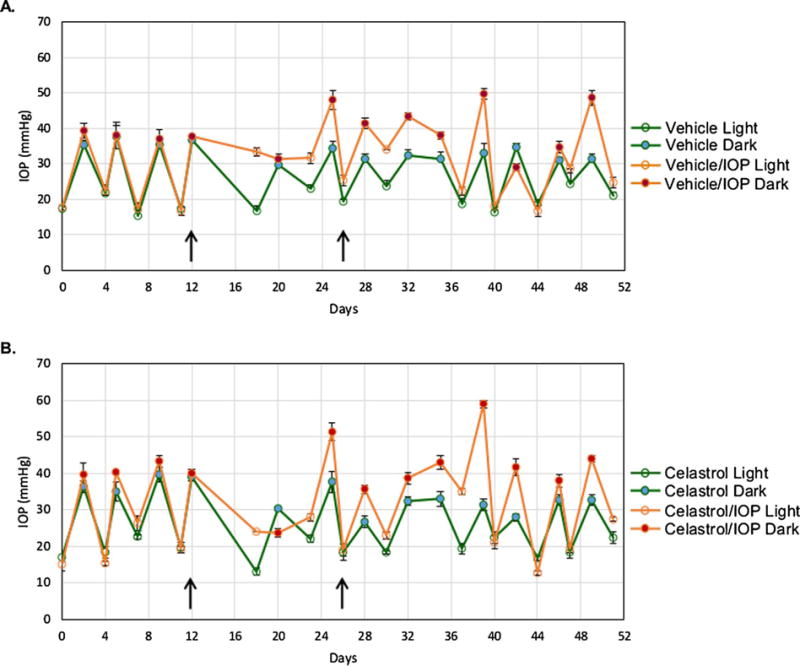
Fig. 1.

Representative IOP profiles for vehicle- (A) and celastrol-treated (B) animals. The light and dark phase IOP readings of an individual rat from the vehicle-treated group (Animal #2334) and celastrol-treated group (Animal #2325) are shown. One IOP reading was recorded by TonoLab after five successful measurements were made. Three IOP readings were used for IOP analysis in this experiment. Data are presented as mean ± SD. The laser trabecular meshwork photocoagulation indicated by arrows was performed unilaterally, twelve days after establishing the baseline IOP, and was repeated two weeks later to maintain elevated IOP during the course of experiment. The contralateral eyes received no treatment and served as controls.
