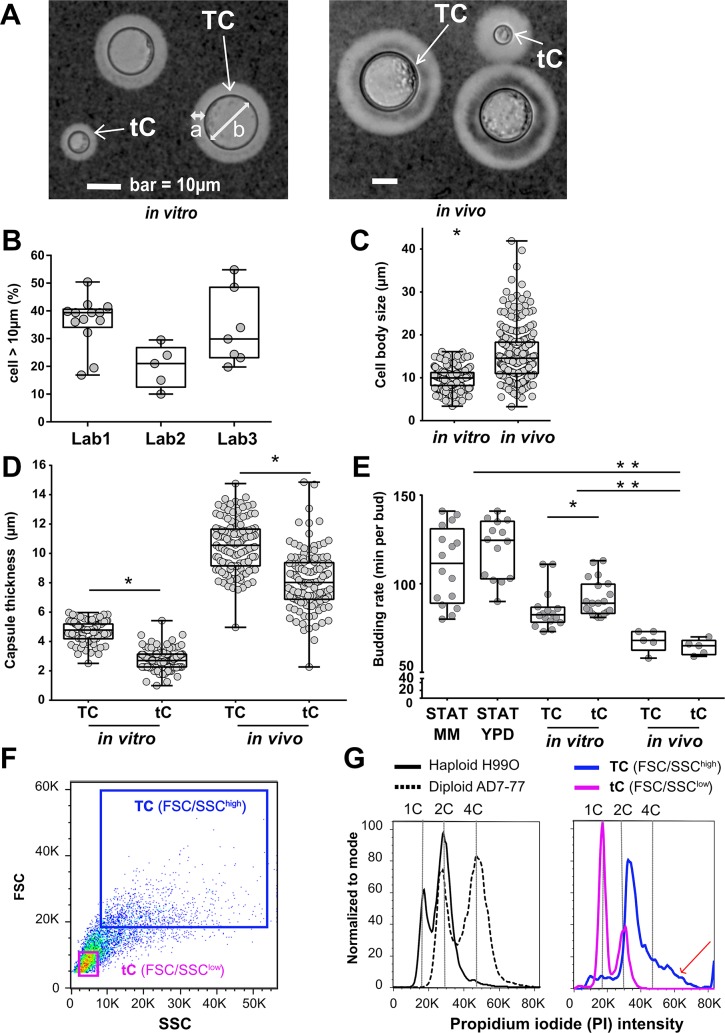
Fig 1. Titan cells generated in vitro harbor the typical phenotype of titan cells produced in vivo.
(A) Specific morphology of titan cells (TC, white arrow) in vitro (left panel) and in vivo (right panel) was observed: enlarged capsule (a), increased cell body size > 10 μm (b), thickened cell wall, large central vacuole, and peripheral cell cytoplasm distribution) while the size of typical cells (tC, white arrow) is <10 μm. (B) Titan cells were reproducibly generated in lab 1 using H99O and in two independent laboratories (lab 2 and lab 3) using their local H99O strain. Cell size was measured manually or by using the Icy software on pictures taken in bright field. Each dot represents an independent experiment (median [interquartile range, IQR] are presented); (C) Cell body size is increased in vivo compared to in vitro. Dots represent individual cells, and boxes median and IQR for 230 cells each (*p<0.0001) (D) Capsule size measured after India ink staining was significantly larger in titan cells (TC) than in typical cells (tC) both in vitro and in vivo, in general, the capsule was larger in vivo independently of the cell size (p<0.0001). Dots represent individual cells, and boxes median and IQR for 250 cells each (*p<0.001); (E). The budding rate of titan cells was lower compared to that of typical cells upon incubation in minimal medium (MM) after titan cells generation in vitro *(p = 0.018) but not in vivo. In vivo, budding rate of titan cells (TC) and typical cells (tC) were equivalent and increased as compared to in vitro titan cells and typical cells and controls (**p<0.001).(F) The yeasts recovered at step 4 of the protocol and analyzed by dot plots (FSC/SSC) using flow cytometry included two populations FSC/SSChigh and FSC/SSClow representing titan cells (TC) and typical cells (tC), respectively; (G) DNA content analysis after propidium iodide (PI) staining showed that the titan cells (FSC/SSChigh) population harbored increased PI fluorescence intensity from 2C to >4C (red arrow) as compared to the diploid control (AD7-77 cultured in Sabouraud agar) while the typical cells (FSC/SSClow) population harbored a PI intensity comparable to the haploid control (H99O cultured in Sabouraud agar).

