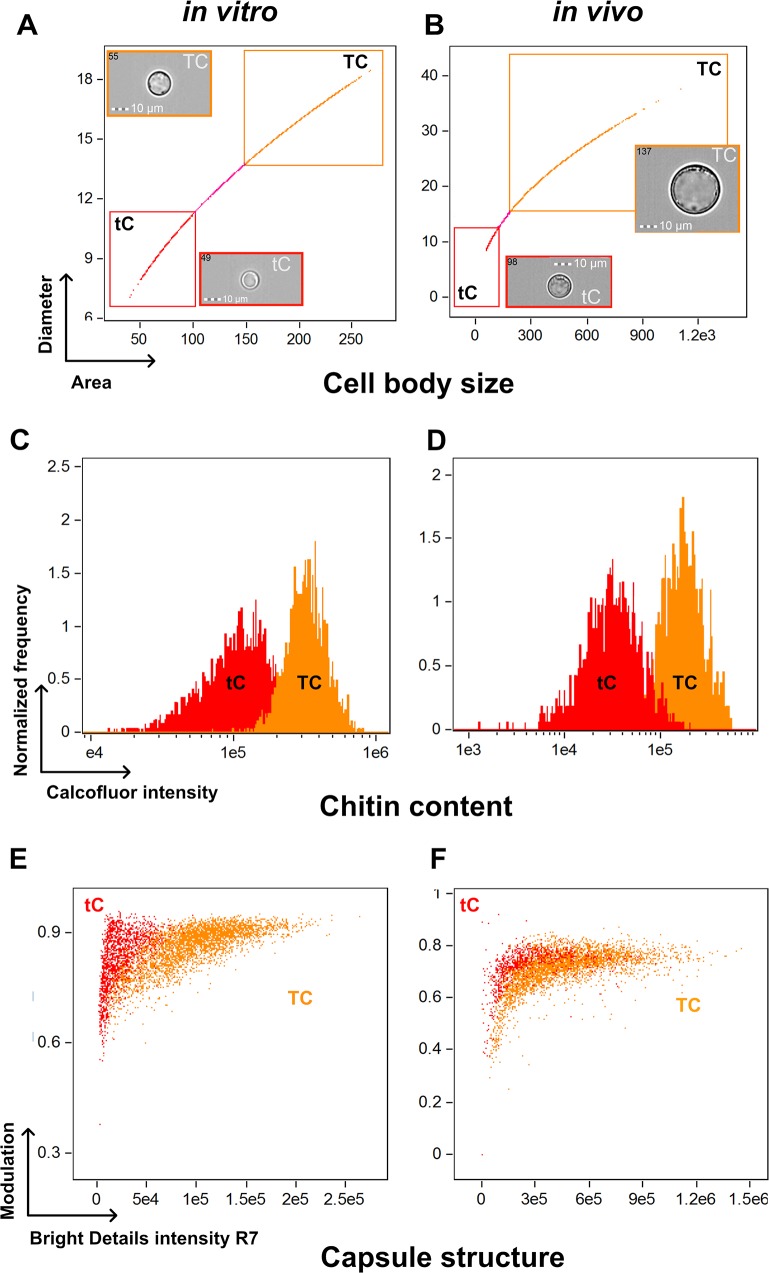
Fig 2. Titan cells harbor an increased chitin content and capsule structure in vitro and in vivo using multispectral imaging flow cytometry.
(A) Titan cells (TC) and typical cells (tC) were selected in the corresponding gates based on the Area/Diameter dot plot. (B) Titan cells in vivo are bigger than that produced in vitro. The chitin content based on calcofluor white (CFW) fluorescence intensity showed significantly increased fluorescence of titan cells compared to typical cells in vitro (C) and in vivo (D). Based on the fluorescence pattern of the 2D10 anti-capsular monoclonal antibody, the algorithms "modulation" and "bright details intensity R7" allowed to discriminate the capsule structure of titan cells and typical cells with almost no overlap between both population in vitro (E) and in vivo (F).

