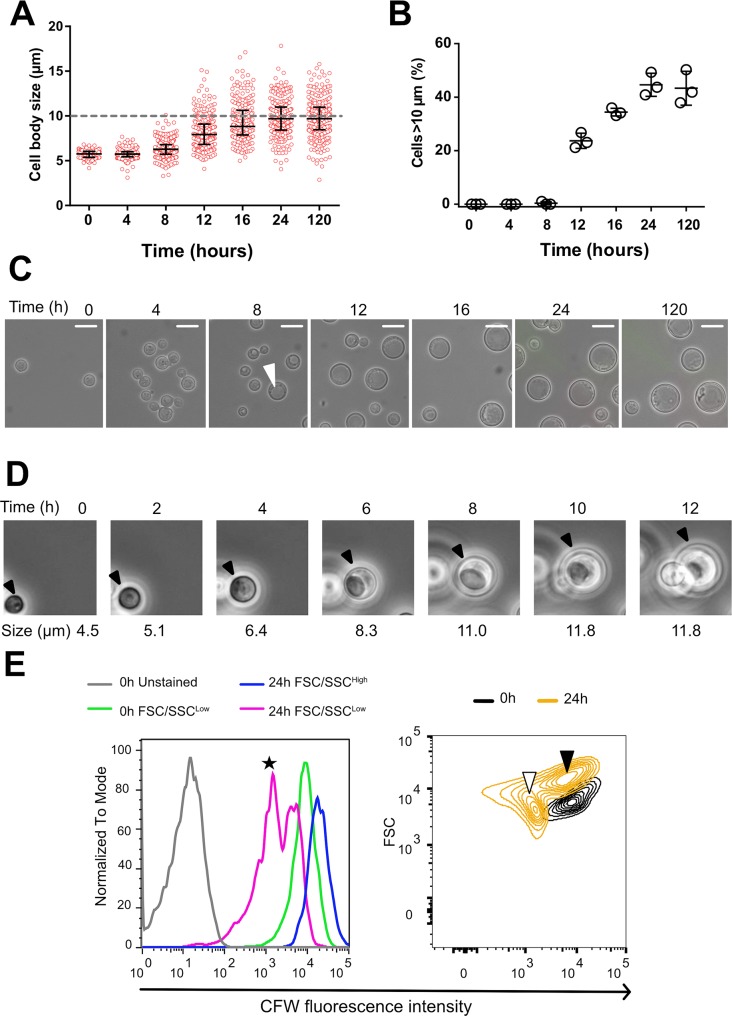
Fig 3. Dynamics of titan cells generation in vitro.
(A) Cell body size was measured from samples of H99O culture (step 3 of the protocol) withdrawn at specific times (H0 to H120) using pictures taken in bright field and measured with the ICY software (mean number of yeasts counted ± SD = 219 ± 67, representative of three experiments). Cell size increased starting at H8 with some cells reaching the threshold of 10 μm (grey dashed line). Each dot represents a single cell and the bars represent median and IQR; (B) Titan cells generation started between H8 and H12 and reached a plateau at H24. Each dot represents the proportion of titan cells in the corresponding sample (3 independent experiments); (C) Pictures (x400 magnification) taken overtime showing the progressive increase in cell body size and the appearance of a vacuole typical of titan cells in a large cell at H8 (white arrow) (scale bar 10 μm); (D) Time lapse imaging of titan cells generation over 12 h showing that titan cells swelled progressively from a small cell and produced daughter cells after having increased their size. (E) Cells stained with calcofluor (CFW) at 0.1 μg/mL prior to incubation using our protocol. CFW fluorescent intensity is analyzed by flow cytometry in the initial (H0) and the resulting FSC/SSChigh (titan cells) and FSC/SSClow (typical cells) observed at H24. The initial (H0) (green line) and the H24 FSC/SSChigh (blue line) populations harbored a high CFW fluorescence suggesting that they are mother cells, with a higher fluorescence for the FSC/SSChigh, while two populations of high and low (black star) CFW fluorescence intensity were observed for the H24 FSC/SSClow cells (Left panel). The right panel shows the size (FSC) and CFW fluorescence intensity of the yeast populations at H0 (black content lines) and H24 (yellow content lines). The initial population (CFWhigh/FSClow) evolved in two populations, one corresponding to daughter cells (typical cells, CFWlow/FSClow, white arrow), and the other one corresponding to titan cells (CFWhigh/FSChigh, black arrow).

