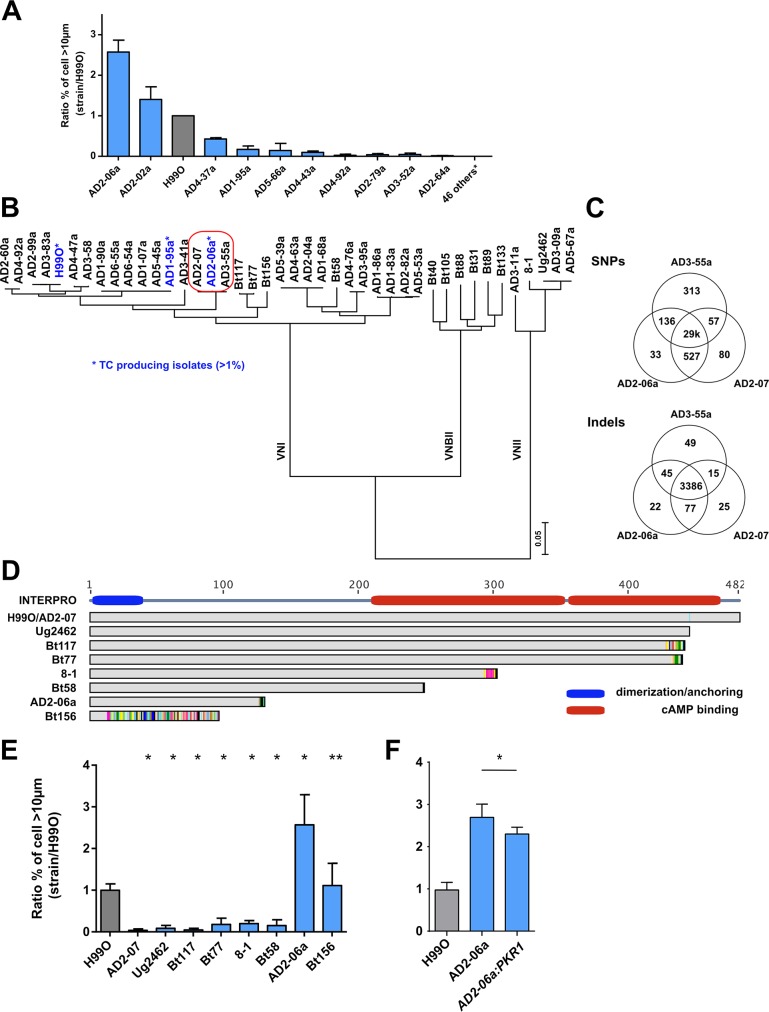
Fig 8. Non-synonymous mutation of PKR1 enhances titan cells generation based on clinical isolates analysis.
(A) The screening of 56 C. neoformans serotype A MATα french clinical isolates identified isolates AD2-06a (ratio = 2.6±0.2) and AD2-02a (ratio = 1.4±0.2) as titan cells producers compared to H99O (grey bar); (B) Phylogenic tree of the isolates (n = 41) for which the whole sequence was available [38,39] was estimated using RAxML under the GTRCAT model. This shows that AD2-06a, AD2-07 and AD3-55a are phylogenetically close together. (C) Venn diagram representing the number of common or specific SNPs and Indel between AD2-06a, AD2-07 and AD3-55a. One of the four AD2-06a specific SNPs is a non-synonymous mutation in the PKR1 gene (mutation Gly125fs); (D) Alignment of Pkr1 protein sequences from selected clinical isolates including H99O and AD2-07 that both harbor a wild type sequence. The Pkr1 domain architecture is formed by a dimerization domain in green (amino acids 2 to 40) and two cAMP binding sites based on INTERPRO model in red (amino acids 219 to 351 and 353 to 473). (E) Strains with PKR1 loss-of-function mutation showed a variable ability to produce titan cells, as compared to H99O (grey bar). The clinical isolate AD2-07, which produces significantly less titan cells was recovered from the CSF of an HIV-positive patient on d 13 of amphotericin B treatment while AD2-06a, which produced the highest proportion of titan cells, was recovered from the initial CSF sample of the same patient. (F) Complementation of PKR1 gene (AD2-06a:PKR1) in the naturally deficient strain AD2-06a reduced titan cells generation compared to AD2-06a. The ratio to H99O, used as a calibrator in each experiment, was calculated for each strain (panel A, E, F) and results expressed as mean ±SD. Experiments A, F and G were done in triplicate, B twice (screening). To compare the experimental conditions to H99O, Khi2 analysis was performed (*p<0.0001, **p<0.05). Mean cell counted ± SD = 1165±528.

