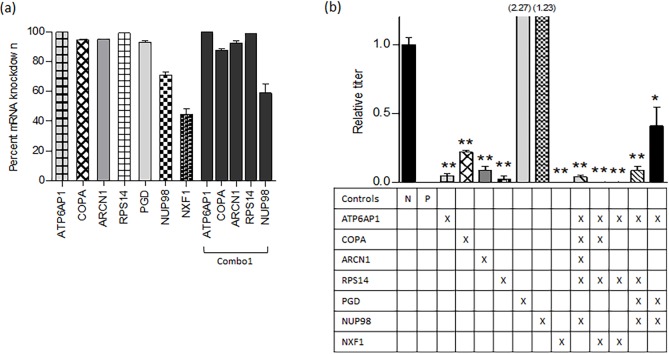
Fig 3. siRNA knockdown of mRNA in NHBE and the impact on influenza A/WSN/1933 (WSN) replication.
(a) Knockdown efficiency of siRNA in NHBE cells; the components within Combo1 are shown as a representative example. Bars represent mean (+ SEM) knockdown relative to non-targeting siRNA 24 hours post transfection. Knockdown data for additional combinations of targets is presented in S1 Table. (b) Inhibition of viral replication when genes were targeted singly, or in combination. For each bar, the targeted genes are shown (X) below. The Allstars negative control (N) and siNP positive control (P) are shown. Results are displayed as normalized to viral growth in cells transfected with non-targeting siRNA. (* p < 0.05, ** p < 0.01). NHBE cells were transfected with siRNA 24 hours after plating. Cells were infected with WSN virus (MOI = 0.2) 24 hours following siRNA transfection and incubated for 48 hours prior to evaluating viral titer by plaque assay.

